
SLIDE 1
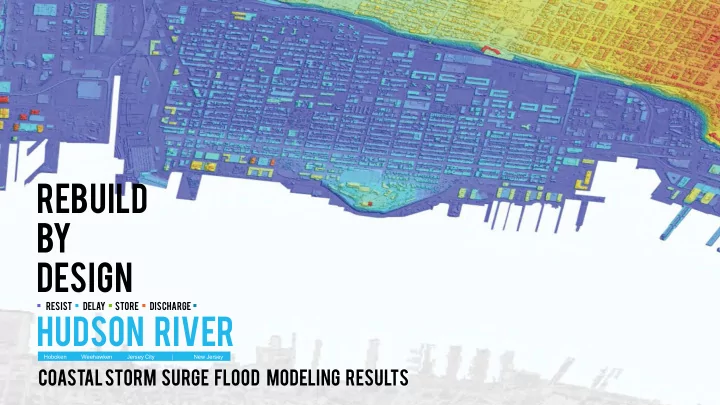
Rebuild By design
▪ RESIST ▪ Delay ▪ Store ▪ Discharge ▪
Hudson River
COASTAL STORM SURGE FLOOD MODELING RESULTS
Hoboken Weehawken Jersey City │ New Jersey
Rebuild By design RESIST Delay Store Discharge Hudson River - - PowerPoint PPT Presentation
Rebuild By design RESIST Delay Store Discharge Hudson River Hoboken Weehawken Jersey City New Jersey COASTAL STORM SURGE FLOOD MODELING RESULTS Animation Showing 100-year Coastal
▪ RESIST ▪ Delay ▪ Store ▪ Discharge ▪
Hoboken Weehawken Jersey City │ New Jersey
No Action Alternative Alternative 1
No Action Alternative Alternative 2
No Action Alternative Alternative 3
NHSA WWTP Washington Street Filled Long Slip Canal Hoboken Terminal Areas with water depth > 8 feet Areas with water 4.5
deep
Flood waters enter Hoboken & Jersey City via the NJT Hoboken Terminal Flood waters enter the north via the Weehawken Cove area.
NHSA
NHSA WWTP
Weehawken Cove
NHSA WWTP
Weehawken Cove
area no storm surge flooding
No Action Alternative Alternative 1
Filled Long Slip Canal Hoboken Terminal Washington Street Washington Street Hoboken Terminal Filled Long Slip Canal
shows resist feature alignment
No Action Alternative Alternative 1
Alternative 1
GREEN shows decreases in flood depth in inches PINK shows increases in flood depth in inches shows resist feature alignment
No Action Alternative Alternative 1
Alternative 1
GREEN shows decreases in flood depth in inches PINK shows increases in flood depth in inches shows resist feature alignment
No Action Alternative Alternative 2
Weehawken Cove Weehawken Cove
area no storm surge flooding
Washington Street Hoboken Terminal Filled Long Slip Canal NHSA NHSA Washington Street Hoboken Terminal Filled Long Slip Canal
shows resist feature alignment
No Action Alternative Alternative 2
Alternative 2
GREEN shows decreases in flood depth in inches PINK shows increases in flood depth in inches shows resist feature alignment
No Action Alternative Alternative 2
Alternative 2
GREEN shows decreases in flood depth in inches PINK shows increases in flood depth in inches shows resist feature alignment
No Action Alternative Alternative 3
NHSA Washington Street Hoboken Terminal Filled Long Slip Canal Weehawken Cove Weehawken Cove
area no storm surge flooding
Washington Street Hoboken Terminal Filled Long Slip Canal NHSA NHSA Washington Street Hoboken Terminal Filled Long Slip Canal
shows resist feature alignment
No Action Alternative Alternative 3
Alternative 3
Weehawken Cove
GREEN shows decreases in flood depth in inches PINK shows increases in flood depth in inches shows resist feature alignment
No Action Alternative Alternative 3
Alternative 3
GREEN shows decreases in flood depth in inches PINK shows increases in flood depth in inches shows resist feature alignment
NHSA NHSA
No Action Alternative Alternative 1 Alternative 2
Weehawken Cove Weehawken Cove
NHSA WWTP
Weehawken Cove NHSA
Washington Street Hoboken Terminal Filled Long Slip Canal
area no storm surge flooding
NHSA WWTP
Weehawken Cove
area no storm surge flooding
Washington Street Hoboken Terminal Filled Long Slip Canal NHSA WWTP
Weehawken Cove
area no storm surge flooding
Washington Street Hoboken Terminal Filled Long Slip Canal
Alternative 3
NHSA NHSA
shows resist feature alignment
Alternative 1 Alternative 2 Alternative 3
Weehawken Cove Weehawken Cove Weehawken Cove
GREEN shows decreases in flood depth in inches PINK shows increases in flood depth in inches shows resist feature alignment
Alternative 1 Alternative 2 Alternative 3
GREEN shows decreases in flood depth in inches PINK shows increases in flood depth in inches shows resist feature alignment
No Action Alternative Alternative 1 Alternative 2 Alternative 3
NHSA
NHSA WWTP
Weehawken Cove NHSA
Washington Street Hoboken Terminal Filled Long Slip Canal NHSA WWTP
Weehawken Cove
area no storm surge flooding
NHSA
Washington Street Hoboken Terminal Filled Long Slip Canal NHSA WWTP
Weehawken Cove NHSA
area no storm surge flooding
Washington Street Hoboken Terminal Filled Long Slip Canal NHSA WWTP
Weehawken Cove
area no storm surge flooding
NHSA
Washington Street Hoboken Terminal Filled Long Slip Canal
shows resist feature alignment
Alternative 1 Alternative 2 Alternative 3
Weehawken Cove Weehawken Cove Weehawken Cove
GREEN shows decreases in flood depth in inches PINK shows increases in flood depth in inches shows resist feature alignment
Alternative 1 Alternative 2 Alternative 3
GREEN shows decreases in flood depth in inches PINK shows increases in flood depth in inches shows resist feature alignment