Reaction Rates Reaction Rates C 4 H 9 Cl( aq ) + H 2 O( l ) C 4 H 9 - - PDF document

reaction rates reaction rates
SMART_READER_LITE
LIVE PREVIEW

Reaction Rates Reaction Rates C 4 H 9 Cl( aq ) + H 2 O( l ) C 4 H 9 - - PDF document

kineticspresentationstudent notes 2014.notebook Kinetics Chemical Kinetics kineticsmultiplechoicefreeresponse questions only.doc 25 Rate and Order Comp.doc AP Reaction Rates 2013.docx ChemQuest 4442.doc Skill Practice 4244.doc


slide-1
SLIDE 1

kinetics­presentation­student notes 2014.notebook 1

Chemical Kinetics

AP Reaction Rates 2013.docx kinetics­multiple­choice­free­response questions only.doc ChemQuest 44­42.doc Skill Practice 42­44.doc Schedule 10­7­10­28 2013.docx 25 Rate and Order Comp.doc

Kinetics Factors That Affect Reaction Rates

Be able to describe how the rate is affected by each through Collision Theory....
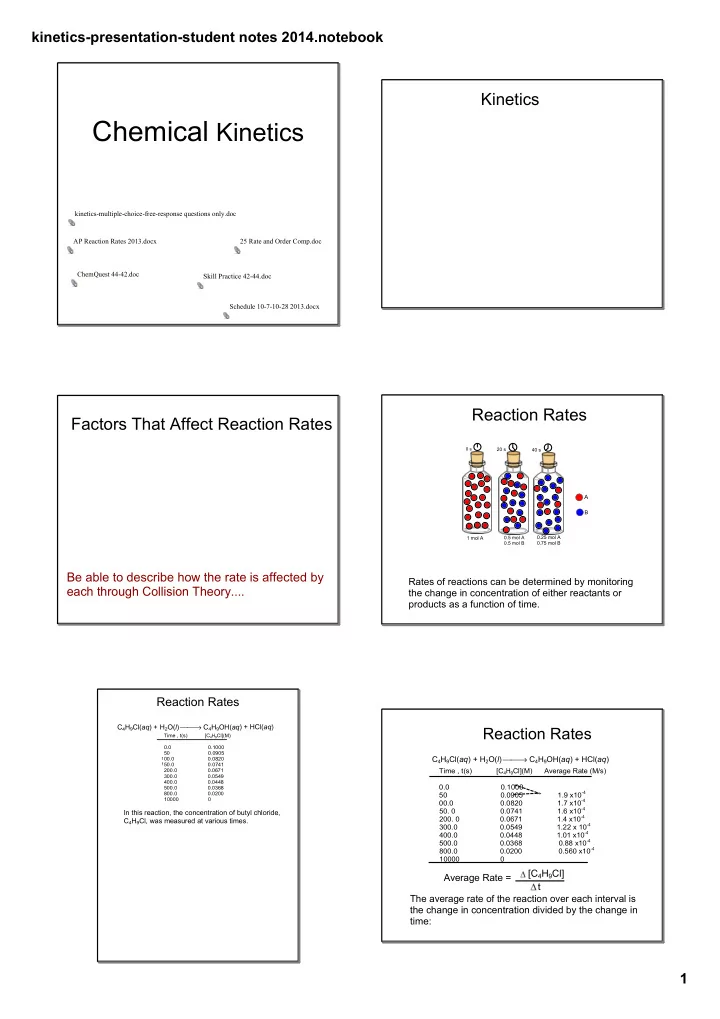
Reaction Rates

Rates of reactions can be determined by monitoring the change in concentration of either reactants or products as a function of time.

0 s 20 s 40 s 1 mol A 0.5 mol A 0.5 mol B 0.25 mol A 0.75 mol B

A B

Reaction Rates

C4H9Cl(aq) + H2O(l) → C4H9OH(aq) + HCl(aq) In this reaction, the concentration of butyl chloride, C4H9Cl, was measured at various times.

Time , t(s) [C4H9Cl](M) 0.0 0.1000 50 0.0905 00.0 0.0820 50.0 0.0741 200.0 0.0671 300.0 0.0549 400.0 0.0448 500.0 0.0368 800.0 0.0200 10000 0

1 1

Reaction Rates

C4H9Cl(aq) + H2O(l) → C4H9OH(aq) + HCl(aq)

The average rate of the reaction over each interval is the change in concentration divided by the change in time:

Time , t(s) [C4H9Cl](M) Average Rate (M/s) 0.0 0.1000 50 0.0905 1.9 x10­4 00.0 0.0820 1.7 x10­4

  • 50. 0 0.0741 1.6 x10­4
  • 200. 0 0.0671 1.4 x10­4

300.0 0.0549 1.22 x 10­4 400.0 0.0448 1.01 x10­4 500.0 0.0368 0.88 x10­4 800.0 0.0200 0.560 x10­4 10000 0

Average Rate = [C4H9Cl] t

slide-2
SLIDE 2

kinetics­presentation­student notes 2014.notebook 2

Reaction Rates

C4H9Cl(aq) + H2O(l) → C4H9OH(aq) + HCl(aq)

Time , t(s) [C4H9Cl](M) Average Rate (M/s) 0.0 0.1000 50 0.0905 1.9 x10­4 00.0 0.0820 1.7 x10­4

  • 50. 0 0.0741 1.6 x10­4
  • 200. 0 0.0671 1.4 x10­4

300.0 0.0549 1.22 x 10­4 400.0 0.0448 1.01 x10­4 500.0 0.0368 0.88 x10­4 800.0 0.0200 0.560 x10­4 10000 0

  • Note that the average rate decreases as the reaction proceeds.

WHY?

Reaction Rates

  • A plot of [C4H9Cl] vs.

time for this reaction yields a curve like this.

  • The slope of a line

tangent to the curve at any point is the instantaneous rate at that time.

C4H9Cl(aq) + H2O(l) → C4H9OH(aq) + HCl(aq)

Instantaneous rate at t=600s

[C4H9Cl] (M) x 10­2 Time (s)

Instantaneous rate at t=0s

  • All reactions slow

down over time.

  • Therefore, the best

indicator of the rate of a reaction is the instantaneous rate near the beginning of the reaction.

Reaction Rates

C4H9Cl(aq) + H2O(l) → C4H9OH(aq) + HCl(aq)

Instantaneous rate at t=600s

[C4H9Cl] (M) x 10­2 Time (s)

Instantaneous rate at t=0s

Reaction Rates and Stoichiometry

  • In this reaction, the ratio
  • f C4H9Cl to C4H9OH is

1:1.

  • Thus, the rate of

disappearance of C4H9Cl is the same as the rate of appearance of C4H9OH.

C4H9Cl(aq) + H2O(l) → C4H9OH(aq) + HCl(aq)

Instantaneous rate at t=600s

[C4H9Cl] (M) x 10­2 Time (s)

Instantaneous rate at t=0s

Rate [C4H9Cl] t ­ t [C4H9OH] = =

Reaction Rates and Stoichiometry

  • What if the ratio is not 1:1?

2HI(g) H2(g) + I2(g)

Reaction Rates and Stoichiometry

  • To generalize, then, for the reaction

aA + bB cC + dD

slide-3
SLIDE 3

kinetics­presentation­student notes 2014.notebook 3

Concentration and Rate

One can gain information about the rate of a reaction by seeing how the rate changes with changes in concentration.

Concentration and Rate

NH4

+(aq) + NO2−(aq)

N2(g) + 2 H2O(l)

Experiment Initial[ NH4

+] Initial [NO2 ­ ] Observed initial

number (M) [M] Rate (M/s) 1 0.0100 0.200 5.4 x10­7 2 0.0200 0.200 10.8 x10­7 3 0.0400 0.200 21.5 x10­7 4 0.200 0.0202 10.8 x10­7 5 0.200 0.0404 21.6 x10­7 6 0.200 0.0808 43.3 x10­7

Likewise, when we compare Experiments 5 and 6, we see ______________________________________

Concentration and Rate

NH4

+(aq) + NO2−(aq)

N2(g) + 2 H2O(l)

Experiment Initial[ NH4

+] Initial [NO2 ­ ] Observed initial

number (M) [M] Rate (M/s) 1 0.0100 0.200 5.4 x10­7 2 0.0200 0.200 10.8 x10­7 3 0.0400 0.200 21.5 x10­7 4 0.200 0.0202 10.8 x10­7 5 0.200 0.0404 21.6 x10­7 6 0.200 0.0808 43.3 x10­7

Concentration and Rate Rate Laws

Order of the reaction can be determined only from experimental data. Concentration changes → Rate independent → zero order Concentration doubles → Rate doubles → first order Concentration doubles → Rate quadruples → second order

Order of a reaction

slide-4
SLIDE 4

kinetics­presentation­student notes 2014.notebook 4 AP Questions 2002 & 2003.doc

AP Chemistry Exam 2003 5Br­ (aq) + BrO3­ (aq) + 6H+ (aq) ­­­> 3Br2 (l) + 3H2O (l) In a study of the kinetics of the reaction represented above, the following data were

  • btained at 298 K.

a. From the data given above, determine the order of the reaction for each reactant listed below. Show your reasoning. i. Br­ ii. BrO3

­

iii. H+ b. Write the rate law for the overall reaction. c. Determine the value for the specific rate constant for the reaction at 298 K. Include the correct unit.

Integrated rate law equations can be used to determine the concentration of either a reactant or a product at any time.

Integrated Rate Laws

In a typical problem, you may be asked to find either: 1) concentration of a reactant at a given time, t, after the start of a rxn 2) the time it takes for a certain amount of reactant to be consumed 3) the time it takes for the concentration of a reactant or product to reach a certain level

Integrated Rate Laws

Using calculus to integrate the rate law for a first­order process gives us R= k[A] time 0 to t Where

[A]0 is the initial concentration of A, and [A]t is the concentration of A at some time, t, during the course of the reaction.

ln [A]t [A]0 =­kt

Integrated Rate Laws

Manipulating this equation produces… …which is in the form

y = mx + b

ln [A]t [A]0 =­kt ln[A]t ­ ln[A]0 = ­kt ln[A]t = ­kt + ln[A]0

First­Order Processes

Therefore, if a reaction is first­order, a plot

  • f ln [A] vs. t will yield a straight line, and the

slope of the line will be ­k.

ln [A]t = ­kt + ln [A]0

First­Order Processes

Consider the process in which methyl isonitrile is converted to acetonitrile. CH3NC CH3CN CH3NC CH3CN

slide-5
SLIDE 5

kinetics­presentation­student notes 2014.notebook 5

First­Order Processes

This data was collected for this reaction at 198.9 °C. CH3NC CH3CN

First­Order Processes

  • When ln P is plotted as a function of time, a straight

line results.

  • Therefore,
  • The process is first­order.
  • k is the negative of the slope: 5.1 × 10­5 s­1.

Second­Order Processes

Similarly, integrating the rate law for a process that is second­order in reactant A, R= k[A]2, we get 1 [A]t = kt +

1 [A]0

also in the form

y = mx + b

Second­Order Processes

1 [A]t = kt + 1 [A]0

So if a process is second­order in A, a plot of 1/[A] vs. t will yield a straight line, and the slope of that line is k.

Second­Order Processes

The decomposition of NO2 at 300°C is described by the equation

and yields data comparable to this:

1 2

[NO2], M 0.0 0.01000 50.0 0.00787 100.0 0.00649 200.0 0.00481 300.0 00.0380

Time (s)

NO2 (g) NO (g) + O2 (g) 1 2

Second­Order Processes

Plotting ln [NO2] vs. t yields the graph below

The plot is not a straight line, so the process is not first­order in [A]. Time (s) [NO2], M ln [NO2] 0.0 0.01000 ­4.610 50.0 0.00787 ­4.845 100.0 0.00649 ­5.038 200.0 0.00481 ­5.337 300.0 0.00380 ­5.573

slide-6
SLIDE 6

kinetics­presentation­student notes 2014.notebook 6

Second­Order Processes

Graphing vs. t, however, gives this plot.

1 [NO2]

Because this is a straight line, the process is second order in [A] Time (s) [NO2], M 1 [NO2] 0.0 0.01000 100 50.0 0.00787 127 100.0 0.00649 154 200.0 0.00481 208 300.0 0.00380 263

Half­Life

  • Half­life is defined as the time required for
  • ne­half of a reactant to react.
  • Because [A] at t1/2 is one­half of the original

[A], [A]t = 0.5 [A]0.

Half­Life

For a first­order process, this becomes

ln 0.5 = −kt1/2 −0.693 = −kt1/2 = t1/2 0.693 k

NOTE: For a first­order process, then, the half­ life does not depend on [A]0.

ln 0.5[A]0 = ­kt1/2 [A]0

Half­Life

For a second­order process, kt1/2 [A]0

1

0.5 = + [A]0

1 2 [A]0 kt1/2

= + [A]0

1

2­1 [A]0 [A]0

1 kt1/2

= = 1 [A]0 k = t1/2

The following data was collected for the decomposition of SO2Cl2 SO2Cl2 SO2 + Cl2

Time (s) [SO2Cl2] 0.0250 60 0.0228 120 0.0208 180 0.0190

Is the reaction a 1st or 2nd order reaction? What is the value of the rate constant? Consider the following reaction: 2 NO2 2 NO + O2 The following experimental data was gathered for this reaction:

Time (s) [NO2] 0.0370 45 0.0338 90 0.0311 135 0.0288

Is the reaction a 1st or 2nd order reaction? What is the value of the rate constant?

slide-7
SLIDE 7

kinetics­presentation­student notes 2014.notebook 7

Temperature and Rate

High Temperature Low temperature

180 190 200 210 220 230 240 250 260 1 2 3 4 x y

temperature ( 0C)

x 10­3 k(s­1)

Maxwell–Boltzmann Distributions

Temperature is defined as a measure

  • f the average kinetic

energy of the molecules in a sample.

Fraction of molecules Speed / KE Ea

At any temperature there is a wide distribution of kinetic energies.

Maxwell–Boltzmann Distributions

  • As the temperature

increases, the curve flattens and broadens.

  • Thus at higher

temperatures, a larger population of molecules has higher energy.

Fraction of molecules Speed / KE Ea

If the dotted line represents the activation energy, then as the temperature increases, so does the fraction of molecules that can overcome the activation energy barrier.

Maxwell–Boltzmann Distributions

Fraction of molecules Speed / KE Ea

As a result, the reaction rate increases.

Maxwell–Boltzmann Distributions

This fraction of molecules can be found through the expression where Ea is the activation energy, R is the gas constant and T is the Kelvin temperature.

f = e

­Ea

RT F r a c t i

  • n
  • f

m

  • l

e c u l e s Speed / KE Ea

The Collision Model

  • In a chemical reaction, bonds are broken and new

bonds are formed.

  • Molecules can only react if they collide with each
  • ther.

Temperature and Rate

slide-8
SLIDE 8

kinetics­presentation­student notes 2014.notebook 8

The Collision Model

In a chemical reaction, bonds are broken and new bonds are formed. Molecules can only react if they collide with each other. Furthermore, molecules must collide with the correct

  • rientation and with enough energy to cause bond breakage

and formation.

Cl + ClON Cl2 + NO

Before collision Collision After collision

Temperature and Rate

Svante Arrhenius developed a mathematical relationship between the rate constant, k and Ea: k = A e where A is the frequency factor, a number that represents the likelihood that collisions would occur with the proper orientation for reaction.

­Ea RT

Temperature and Rate The Collision Model

Arrhenius Equation

y = m x + b Therefore, if k is determined experimentally at several temperatures, Ea can be calculated from the slope of a plot

  • f ln k vs. 1/T.

Taking the natural logarithm of both sides, the Arrhenius equation becomes:

which is also in the form

Reaction Coordinate Diagrams

It is helpful to visualize energy changes throughout a process

  • n a reaction coordinate diagram like this one for the

rearrangement of methyl isonitrile.

H3CNC H3CCN

Methyl isonitrile to Methyl nitrile

Reaction pathway P

  • t

e n t i a l e n e r g y Ea

ΔE

Reaction Coordinate Diagrams

Reaction pathway Potential energy

Ea

ΔE

Reaction Coordinate Diagrams

Reaction pathway P

  • t

e n t i a l e n e r g y

Ea ΔE

slide-9
SLIDE 9

kinetics­presentation­student notes 2014.notebook 9

Reaction Coordinate Diagrams

Reaction pathway Potential energy Ea ΔE

Reaction Coordinate Diagrams

Reaction pathway Potential energy

Ea ΔE

Reaction Coordinate Diagrams

Reaction pathway Potential energy

Ea ΔE

  • The diagram shows the

energy of the reactants and products (and, therefore, ∆E).

  • The high point on the

diagram is the transition state.

  • The energy gap between the reactants and the activated

complex is the activation energy barrier.

Reaction Coordinate Diagrams

Reaction pathway Potential energy

  • The species present at the transition state is called the

activated complex.

  • In order for a reaction to
  • ccur, a minimum amount
  • f energy must first be

applied to the reactants.

  • This minimum energy

input is usually needed to break bonds.

Reaction Coordinate Diagrams Reaction Coordinate Diagrams

  • This minimum energy input is

called the Activation Energy, or Ea, energy of activation.

  • Activation energy is the energy

gap between the reactants and the activated complex.

slide-10
SLIDE 10

kinetics­presentation­student notes 2014.notebook 10

  • In this example, the PE of

the products are lower than the PE of the reactants.

  • Therefore, ∆H° is negative

and the reaction is exothermic.

Reaction Coordinate Diagrams Catalysts

This graph shows the decomposition of hydrogen peroxide both with and without a catalyst. Notice that the energies of reactants and products are unchanged by the catalyst.

Reaction Mechanisms

The sequence of events that describes the actual process by which reactants become products is called the reaction mechanism.

Reaction Mechanisms

  • Reactions may occur all at once or through several

discrete steps.

  • Each of these processes is known as an elementary

reaction or elementary process.

Reaction Mechanisms

The molecularity of a process tells how many molecules are involved in the process.

Molecularity Elementary Reaction Rate Law Unimolecular A­­> products Rate =k[A] Bimolecular A+A ­­> products Rate =k[A]2 Bimolecular A+ B ­­> products Rate = k[A][B] Termolecular A+A+A­­> products Rate = k[A]3 Termolecular A+A+B­­> products Rate =k[A]2[B] Termolecular A+B+C­­> products Rate = k[A][B][C]

Multistep Mechanisms

  • In a multistep process, one of the steps will be

slower than all others.

  • The overall reaction cannot occur faster than this

slowest, rate­determining step. step 1 1→2 step 2 2→3

Toll A Toll B 1

2 3 slow

Toll A Toll B

1 2 3 slow

slide-11
SLIDE 11

kinetics­presentation­student notes 2014.notebook 11

Multistep Mechanisms

In a multistep mechanism, the main idea about identifying the rate­determining step is this:

The rate law for the overall reaction is equivalent to the rate law for the slowest, or rate­determining step.

Slow Initial Step

  • The rate law for this reaction is found experimentally

to be Rate = k [NO2]2

  • CO is necessary for this reaction to occur, but the rate
  • f the reaction does not depend on its concentration.
  • This suggests the reaction occurs in two steps.

NO2(g) + CO (g) → NO (g) + CO2 (g)

Slow Initial Step

  • A proposed mechanism for this reaction is

Step 1: NO2 + NO2 → NO3 + NO (slow) Step 2: NO3 + CO → NO2 + CO2 (fast)

  • The NO3 intermediate is consumed in the second

step.

  • As CO is not involved in the slow, rate­determining

step, it does not appear in the rate law.

Toll A Toll B 1

2 3 slow

Fast Initial Step

  • The rate law for this reaction is found to be

Rate = k [NO]2 [Br2] This reaction is termolecular

  • Because termolecular processes are rare∗, this

rate law suggests a two­step mechanism. 2 NO (g) + Br2 (g) → 2 NOBr (g)

∗ collision of three molecules in the correct orientation is very difficult

Fast Initial Step

  • A proposed mechanism is

Step 1 includes the forward and reverse reactions.

K2

Step 2: NOBr2 + NO → 2NOBr (slow) Step 1: NO + Br2 ↔ NOBr2(fast)

K1 K­1

Fast Initial Step

  • The rate of the overall reaction depends upon the rate of

the slow step.

  • The rate law for that step would be

Rate = K2[NOBr2] [NO]

  • But how can we find [NOBr2]?
slide-12
SLIDE 12

kinetics­presentation­student notes 2014.notebook 12

Fast Initial Step

  • NOBr2 can react two ways:
  • 1. With NO to form NOBr
  • 2. By decomposition to reform NO and Br2
  • The reactants and products of the first step are in

equilibrium with each other.

  • Therefore,

Ratef = Rater

Fast Initial Step

  • Because Ratef = Rater ,

k1 [NO] [Br2] = k−1 [NOBr2]

  • Solving for [NOBr2] gives us

K1 K­1 [NO] [Br2]= [NOBr2]

Fast Initial Step

Substituting this expression for [NOBr2] in the rate law for the rate­determining step gives = k [NO]2 [Br2] K2K1 K­1

`

Rate = [NO][Br2][NO]

Catalysts

  • Catalysts increase the rate of a reaction by decreasing

the activation energy of the reaction.

  • Catalysts change the mechanism by which the

process occurs.

Catalysts

One way a catalyst can speed up a reaction is by holding the reactants together and helping bonds to break.

Shown here is hydrogen reacting with ethylene. Both molecules are adsorbed onto the metal (blue) surface which acts as the catalyst.

  • Automobiles are equipped

with catalytic converters, which are part of their exhaust systems.

  • The exhaust gases

contain CO, NO, NO2, and unburned hydrocarbons that pass over surfaces impregnated with catalysts.

Catalytic Converters

  • The catalysts promote the conversion of the exhaust gases into

CO2, H2O, and N2.

slide-13
SLIDE 13

kinetics­presentation­student notes 2014.notebook 13

Enzymes

  • Enzymes are catalysts in biological systems.
  • The substrate fits into the active site of the enzyme much

like a key fits into a lock. Liver contains an enzyme called catalase which speeds up the decomposition of H2O2.

Substrate entering active site of enzyme Enzyme/substrate complex Enzyme/products complex Products leaving active site of enzyme

Active site substrate

slide-14
SLIDE 14

Attachments kinetics­multiple­choice­free­response questions only.doc AP Reaction Rates 2013.docx ChemQuest 44­42.doc Skill Practice 42­44.doc Schedule 10­7­10­28 2013.docx AP Questions 2002 & 2003.doc 25 Rate and Order Comp.doc