
SLIDE 1
Quick Value Statistics in Presentation
20-06-16 1
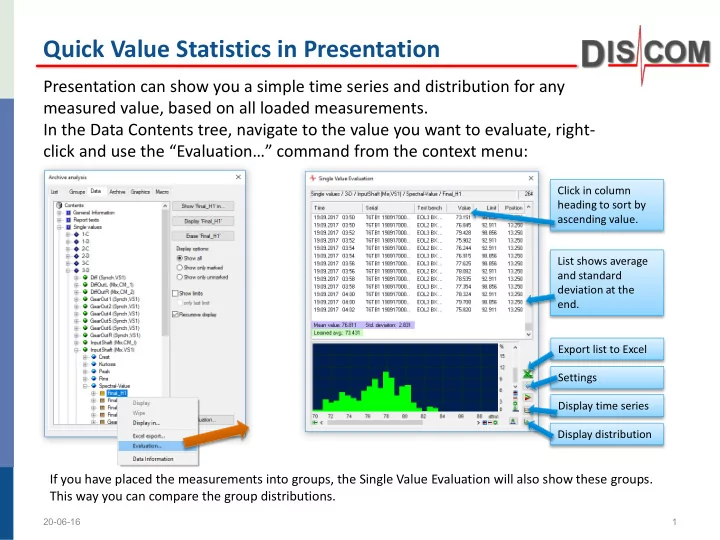
Presentation can show you a simple time series and distribution for any measured value, based on all loaded measurements. In the Data Contents tree, navigate to the value you want to evaluate, right- click and use the “Evaluation…” command from the context menu:
Export list to Excel Settings Display time series Display distribution List shows average and standard deviation at the end. Click in column heading to sort by ascending value.