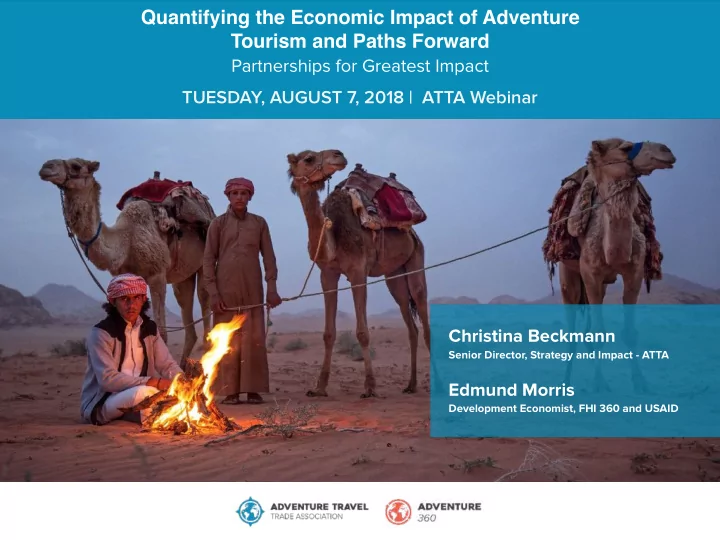

Quantifying the Economic Impact of Adventure Tourism and Paths Forward Partnerships for Greatest Impact TUESDAY, AUGUST 7, 2018 | ATTA Webinar Christina Beckmann Senior Director, Strategy and Impact - ATTA Edmund Morris Development Economist, FHI 360 and USAID
INTRODUCTION Christina Beckmann Christina Beckmann is the Sr. Director for Strategy and Impact at the Adventure Travel Trade Association. With a background in entrepreneurship and management consulting, she has worked on projects to support adventure tourism market development in more than 30 countries. Edmund Morris Edmund Morris is a development economist who specializes in mapping the impact of adventure travel on destinations and developing market system approaches to building destinations, tourism products and improving regulatory systems.
AGENDA • The Adventure Travel Local Analytics System (ATLAS) • Jordan’s adventure market evolution • ATLAS applied to the Jordan Trail • Macedonia’s adventure market evolution • ATLAS potential if applied to the Via Dinarica • Conclusion & Questions
PURPOSE OF ATLAS ATLAS was designed to assess and quantify the theory that adventure travel drives new revenue, creates jobs, and builds new economic opportunities at a local, community level. It is essentially an economic modeling tool that uses existing data to help us better understand the impact destinations are having, and could have, on employment and revenue generation.
ATLAS WILL HELP TO: • Justify investment in destinations and on tourism products • Map the impact of tourism sector on jobs and revenue • Identify high-potential destinations and products using geospatial analysis • Create evidence-based design for national strategies and policy
PROCESS FOR BUILDING ATLAS CONDUCT REVIEW DATA INPUT/OUTPUT SURVEYS NATIONAL CLEANING & TABLES NUMBERS ANALYSIS IF THE COUNTRY HAS IF KEY DATA POINTS ALL DATA IS REVIEWED EXAMINE EXISTING EXISTING INPUT OUTPUT ARE MISSING, WE WILL AND CHECKED FOR DATASETS THAT ARE USE PRIMARY TABLES, WE INTEGRATE ACCURACY. CONTROLS EITHER OPEN DATA, THESE INTO THE SURVEYS WITH TOUR ARE PUT IN PLACE IF PART OF NATIONAL ANALYSIS. IF NOT, WE OPERATORS AND KEY NECESSARY AND RECORDS/ARCHIVES, MODEL IT ON STAKEHOLDERS NUMBERS AGAINST SUCH AS NATIONAL COUNTRIES WITH OTHER DATASETS OR TOURISM SATELLITE SIMILAR MODELS ACCOUNTS CHARACTERISTICS
CASE OF JORDAN
HIGHLIGHTS OF JORDAN’S ADVENTURE EVOLUTION 2008–2018 2017 - 2018 RESULTS •40 new products introduced •Tourism arrivals up 15% • 96% of 2018 AdventureNEXT buyers are ‘very interested’ in adding Jordan, on average 2 new itineraries per buyer
JORDAN ATDI PROGRESSION
THE JORDAN TRAIL
LOCAL ECONOMIC IMPACT OF JORDAN TRAIL INDIRECT IMPACT DIRECT IMPACT 4.4M 3.2M USD 1.6M 2.9M USD USD USD REMAINS IN THE GENERATED INDIRECTLY IN THE LOCAL ECONOMY LOCAL ECONOMY 7.3M 65% TOTAL REVENUE REMAINS IN LOCAL GENERATED ECONOMY
LOCAL ECONOMIC IMPACT OF JORDAN TRAIL 156 DIRECT JOBS CREATED 72 INDIRECT JOBS CREATED 193 84% 2.62 LOCAL OF ALL JOBS LOCAL JOBS CREATED PER JOBS ARE LOCAL 100K USD #ATWS2017 = 10
COMPARING PRODUCTS JORDAN DEAD SEA COMPARATIVE TRAIL TOURISM MODELS 7.3M - 93% TOTAL REVENUE (USD) 101M GENERATED NUMBER OF LOCAL 193 1523 - 87% JOBS % THAT REMAINS IN 65% 14% +51% LOCAL ECONOMY 84% 36% +48% % OF ALL JOBS THAT ARE LOCAL 2.62 1.65 +0.98 LOCAL JOBS CREATED PER 100K USD
CASE OF MACEDONIA � 14
HIGHLIGHTS OF MACEDONIA’S ADVENTURE EVOLUTION 2008–2018 •Tourism contribution to GDP growing: from 1.3% in 2010 to 1.8% in 2016 •Tourism sector added 500 jobs 2017 – 2018 •New adventure trips: 16 since AdventureNext
MACEDONIA’S ADVENTURE TOURISM DEVELOPMENT INDEX SCORE PROGRESSION TOP PERFORMERS MIDDLE PERFORMERS POOR PERFORMERS
� 17
WHAT COULD ATLAS DO FOR THE VIA DINARICA? • Identify revenue generated by the trail • Model the number of sales and potential revenue for operators • Map villages and towns benefitting from the trail, and number of jobs created • Identify return on investment (in GDP , in cost of creating a job, or in indirect revenue terms)
ILLUSTRATIVE DATA FOR A DESTINATION OR PRODUCT # JOBS $ REVENUE # OPERATORS # GUIDES # HOTELS $ AVERAGE SPEND # AVERAGE STAY
SUMMARY
SUMMARY � 21 ATLAS provides us with a snapshot or a detailed analysis of the economic dynamics of di ff erent tourism sectors, destinations or products ATLAS is highly adaptable, providing data that informs investment, policy decisions, market or governmental strategies ATLAS is a tool that excels in the absence of traditional or standardized datasets, using innovative approaches to data acquisition
SUMMARY ANY QUESTIONS?
Recommend
More recommend