
22‐Mar‐15 1
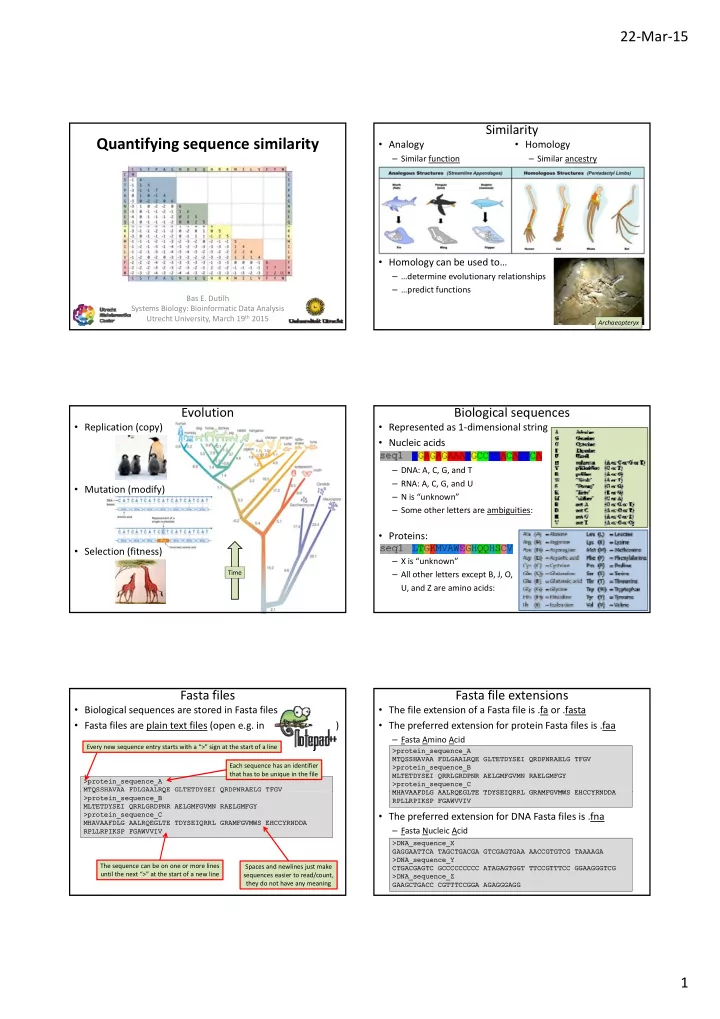
Quantifying sequence similarity
Bas E. Dutilh Systems Biology: Bioinformatic Data Analysis Utrecht University, March 19th 2015
Similarity
- Analogy
– Similar function
- Homology
– Similar ancestry
- Homology can be used to…
– …determine evolutionary relationships – …predict functions
Archaeopteryx
Evolution
- Replication (copy)
- Mutation (modify)
Time
- Selection (fitness)
Biological sequences
- Represented as 1‐dimensional string
- Nucleic acids
– DNA: A, C, G, and T – RNA: A, C, G, and U – N is “unknown” Some other letters are ambiguities: – Some other letters are ambiguities:
- Proteins:
– X is “unknown” – All other letters except B, J, O, U, and Z are amino acids:
- Biological sequences are stored in Fasta files
- Fasta files are plain text files (open e.g. in )
Fasta files
>protein_seque >protein_sequence_A nce_A MT MTQSSHAVAA FDL SSHAVAA FDLGAALR GAALRQE GLTETDYSE E GLTETDYSEI I QRDPNRAELG TFGV RDPNRAELG TFGV Every new sequence entry starts with a “>” sign at the start of a line Each sequence has an identifier that has to be unique in the file Q Q Q Q Q >protein_seque >protein_sequence_B nce_B MLTETDYSEI QRR MLTETDYSEI QRRLGRDPNR AELGMFGVM LGRDPNR AELGMFGVMN RAELGMFGY N RAELGMFGY >protein_seque >protein_sequence_C nce_C MHAVAAFDLG AAL MHAVAAFDLG AALRQEGLTE TDYSEIQRR RQEGLTE TDYSEIQRRL GRAMFGVMWS EHCC L GRAMFGVMWS EHCCYRNDDA YRNDDA RPLLRPIKSP FGA RPLLRPIKSP FGAWVVIV WVVIV The sequence can be on one or more lines until the next “>” at the start of a new line Spaces and newlines just make sequences easier to read/count, they do not have any meaning
Fasta file extensions
- The file extension of a Fasta file is .fa or .fasta
- The preferred extension for protein Fasta files is .faa
– Fasta Amino Acid
>protein_seque >protein_sequence_A nce_A MTQSSHAVAA FDL MTQSSHAVAA FDLGAALRQE GLTETDYSE GAALRQE GLTETDYSEI QRDPNRAELG TFGV I QRDPNRAELG TFGV >protein_seque >protein_sequence_B nce_B MLTETDYSEI QRR MLTETDYSEI QRRLGRDPNR AELGMFGVM LGRDPNR AELGMFGVMN RAELGMFGY N RAELGMFGY >protein_seque >protein_sequence_C nce_C MHAVAAFDLG AAL MHAVAAFDLG AALRQEGLTE TDYSEIQRR RQEGLTE TDYSEIQRRL GRAMFGVMWS EHCC L GRAMFGVMWS EHCCYRNDDA YRNDDA
- The preferred extension for DNA Fasta files is .fna
– Fasta Nucleic Acid
MHAVAAFDLG AAL MHAVAAFDLG AALRQEGLTE TDYSEIQRR RQEGLTE TDYSEIQRRL GRAMFGVMWS EHCC L GRAMFGVMWS EHCCYRNDDA YRNDDA RPLLRPIKSP FGA RPLLRPIKSP FGAWVVIV WVVIV >DNA_sequence_ >DNA_sequence_X GAGGAATTCA TAG GAGGAATTCA TAGCTGACGA GTCGAGTGA CTGACGA GTCGAGTGAA AACCGTGTCG TAAA A AACCGTGTCG TAAAAGA AGA >DNA_sequence_ >DNA_sequence_Y CTGACGAGTC GCC CTGACGAGTC GCCCCCCCCC ATAGAGTGG CCCCCCC ATAGAGTGGT TTCCGTTTCC GGAA T TTCCGTTTCC GGAAGGGTCG GGGTCG >DNA_sequence_ >DNA_sequence_Z GAAGCTGACC CGT GAAGCTGACC CGTTTCCGGA AGAGGGAGG TTCCGGA AGAGGGAGG