
SLIDE 1
1
Interim Report
April-June 2015
Johan Dennelind, President & CEO
Q2
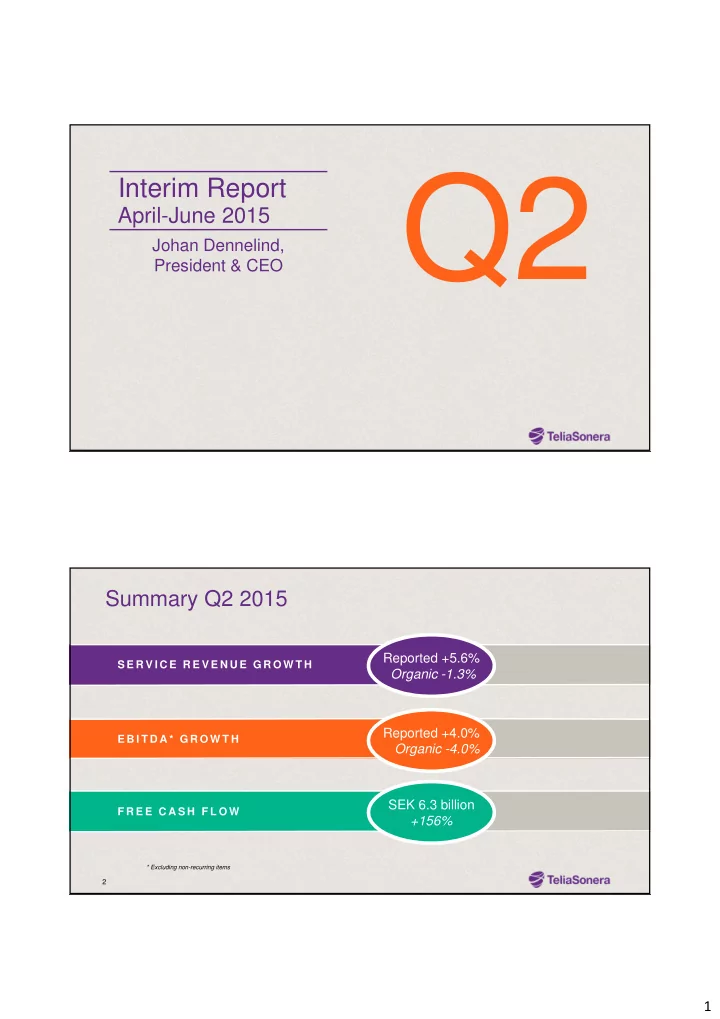
*Summary Q2 2015
2 S E R V I C E R E V E N U E G R O W T H E B I T D A * G R O W T H F R E E C A S H F L O WReported +5.6% Organic -1.3% Reported +4.0% Organic -4.0% SEK 6.3 billion +156%
* Excluding non-recurring items