Q1 January March Profit before tax SEK 799m (6) Result before - - PDF document

q1
SMART_READER_LITE
LIVE PREVIEW

Q1 January March Profit before tax SEK 799m (6) Result before - - PDF document

Interim report 2013 Q1 January March Profit before tax SEK 799m (6) Result before tax, adjusted for items affecting comparability and exit gains, SEK -83m (161) Earnings per share before dilution SEK 2.53 (0) Mixed


slide-1
SLIDE 1

1 January – March Interim report 2013

Profit before tax SEK 799m (6)

Result before tax, adjusted for items affecting comparability and exit gains, SEK -83m (161)

Earnings per share before dilution SEK 2.53 (0)

Mixed performance in the holdings

Stofa exit completed – exit gain SEK 898m

Acquisition of Aibel completed in April

Acquisition of Nebula completed in April

Merger of Finnkino and SF Bio completed in May

Total return on Ratos shares 10%

Interim report 2013 January – March

Q1

Ratos in summary

SEKm 2013 Q 1 2012 Q 1 2012

Profit/share of profits

  • 39
  • 10
  • 29

Exit gains 898 978 Impairment

  • 375

Profit/loss from holdings 859

  • 10

574 Central income and expenses

  • 60

16 193 Profit/loss before tax 799 6 767

slide-2
SLIDE 2

2 January – March Interim report 2013

Events in the first quarter

■ In March, Ratos signed an agreement with Bonnier regarding

a merger of SF Bio and Finnkino, thus forming the Nordic region’s largest cinema business. The new group will be

  • wned to approximately 60% by Ratos and 40% by Bonnier.

The acquisition was completed at the beginning of May and did not involve any capital contributions

■ In March, Ratos signed an agreement, together with Rite

Ventures and the company’s management, to acquire Nebula Oy, Finland’s leading provider of cloud services to small and medium-sized companies. The purchase price (enterprise value) for 100% of the company amounted to EUR 82.5m (approximately SEK 700m), of which Ratos provided equity of EUR 35m (approximately SEK 300m) for a holding corresponding to 72%. A subsequent earn-out may be paid provided certain profitability milestones are

  • achieved. The acquisition was completed in April

■ In January, the sale of the remaining subsidiary in Contex

Group, Contex A/S, was completed. The selling price (enterprise value) amounted to USD 41.5m (approximately SEK 275m). The winding up of Contex Group has started and Ratos received a payment of SEK 154m in January. An additional amount of approximately SEK 10m is expected when the winding up is completed. Ratos’s average annual return (IRR) on the entire investment in Contex Group was

  • 16%

■ In February, the sale was completed of the subsidiary Stofa

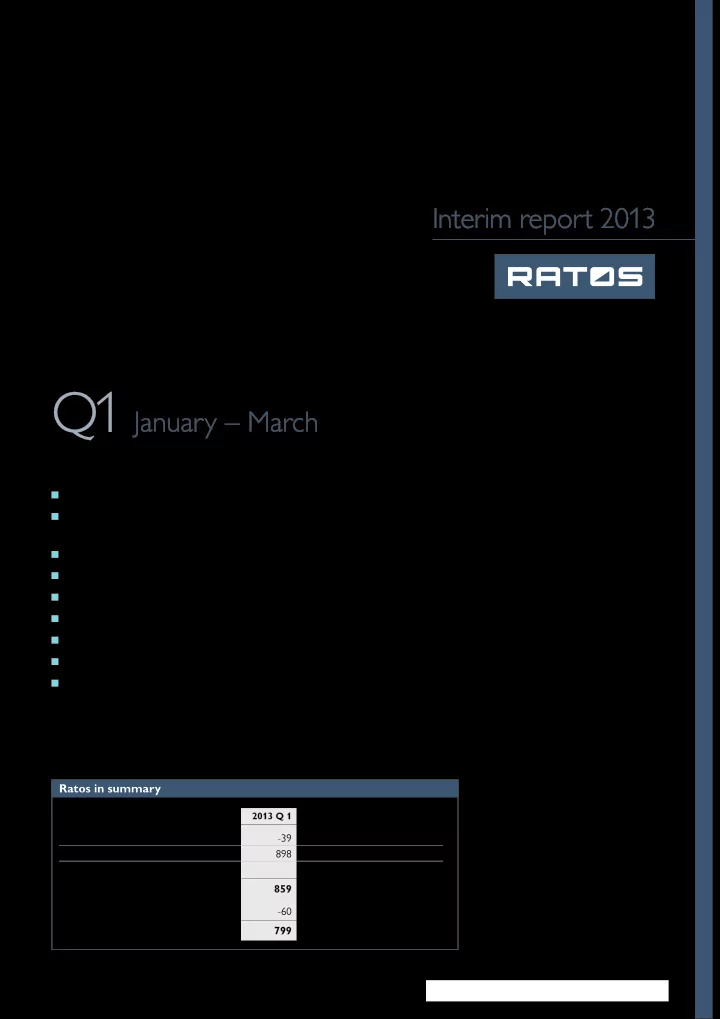
for DKK 1,900m (approximately SEK 2,200m) (enterprise value). The sale generated a capital gain for Ratos of ap- proximately SEK 898m and an average annual return (IRR)

  • f approximately 55%

■ In January, Arcus-Gruppen completed the acquisition of the

brands Aalborg, Brøndums, Gammel Dansk and Malteser. The purchase price (enterprise value) amounted to EUR 103m (approximately SEK 880m) and Ratos provided SEK 77m. A sales process for Brøndums is underway as required by the competition authorities

Events after the end of the period

■ The acquisition of Aibel announced in December was

completed in April. Enterprise value for 100% of Aibel amounted to NOK 8,600m. Ratos acquired 32% of the company and provided equity of NOK 1,429m (approxi- mately SEK 1,680m). Sales in Aibel for the first quarter of 2013 amounted to NOK 3,224m (2,415) and EBITA was NOK 141m (138)

■ Capital contribution to Jøtul of approximately SEK 40m ■ Ratos held an Extraordinary General Meeting on 25 April

in order, according to “the Leo rules”, to obtain approval to transfer all the shares in the subsidiary BTJ Group AB to Per Samuelson, Chairman of the Board of BTJ Group. The purchase price for all the shares amounted to SEK 1. Taking the company’s net debt into account, the purchase price corresponds to an enterprise value of approximately SEK 43m. The Meeting resolved to approve the transfer which was completed in May. The sale did not have any earnings impact on Ratos More information about important events in the holdings is provided on pages 8-13.

Important events

To facilitate analysis, an extensive table is provided on page 13 with key figures for Ratos’s holdings. A summary of income statements, statements

  • f financial position, etc., for Ratos’s associates and subsidiaries is available

in downloadable Excel files at www.ratos.se.

Performance Ratos’s holdings *)

2013 Q 1

100% Ratos’s share Sales

  • 7%
  • 7%

EBITA +19% +18% EBITA, excluding items affecting comparability

  • 20%
  • 21%

EBT n/a n/a EBT, excluding items affecting comparability

  • 57%
  • 56%

*) Comparison with corresponding period last year and for comparable

units.

slide-3
SLIDE 3

3 January – March Interim report 2013

In terms of earnings, the first quarter of 2013 was strong for Ratos, mainly against the background of the comple- tion of our sale of Stofa in February. We also come from a 2012 in which we carried out unusually extensive action programmes in the holdings, which are now reflected in lower restructuring costs and therefore rising reported

  • perating profits. Market conditions weakened again somewhat during the first quarter of 2013 and were charac-

terised by uncertainty and caution. This contributed to lower sales and the development of the adjusted operating profit for the holdings overall was weaker than expected. However, the first quarter is the smallest in earnings terms for Ratos’s companies which this year were also affected by the fact that there were fewer working days compared with the previous year. Overall, we have not changed our cautiously optimistic view of 2013, and our basic scenario is that markets will gradually stabilise during the year.

Sluggish markets

At the end of 2012, Ratos’s holdings overall experienced slightly more stable market conditions compared with earlier in the

  • year. Global macroeconomic signals were also increasingly posi-
  • tive. Given the geographic exposure of Ratos’s companies to

the Nordic region and Western Europe, we expected continued sluggish markets in 2013, at least in the first half, followed by a slight recovery towards the end of the year. The first quarter was somewhat weaker than expected,

  • however. Growing unease about development in Europe and a

slow recovery in the US affected the market climate. Some sectors were affected more than others. For example, the build- ing materials market in Sweden had a very weak quarter as well as weak order bookings. Nevertheless, our overall view of the future trend is unchanged and we are receiving cautiously positive market signals from a growing number of holdings. There are, however, continued clear risks on the downside.

Mixed performance in the holdings

The first quarter is always the most difficult to assess in terms

  • f earnings for Ratos’s holdings. It is a small quarter in relative

terms, which this year was also affected by having fewer work- ing days than last year (due among other things to the Easter holiday being in March this year and in April last year). For some companies the cold winter also had an impact. Sales for the holdings fell 7% in the first quarter (-7% ad- justed for size of holding) and adjusted EBITA (operating profit adjusted for items affecting comparability) decreased by 20% (-21% adjusted for size of holding). Here there is a clear effect from the lower number of working days. The assessment is that this had a negative impact on sales of a couple of percentage points and explains up to half the decline in adjusted operating profit. Reported operating profit (EBITA) increased by 19% (+18% adjusted for size of holding) which is a clear effect of the unusually extensive action programmes carried out in the holdings during 2012. Provided the economy does not weaken further, these activities will be fewer this year and this means that items affecting comparability are expected to be lower in 2013 compared with 2012. Despite some effects from the economic climate, many

  • f the holdings continue to develop according to plan. For

example, GS-Hydro and Finnkino continued to perform well during the quarter, as did our new holding, Aibel (included in the accounts from the second quarter). It is also positive that we can see the first signs that development in the three holdings

Performance during the first quarter

with structural challenges, Jøtul, AH Industries and DIAB, are heading in the right direction. The action programmes are having an effect and performance is stabilising despite a continued low level of market activity. We monitor the market and our hold- ings very carefully and are well prepared should development deviate from plans.

High level of transaction activity

We were highly active on the acquisition side during the first quarter and concluded agreements to acquire the Finnish company Nebula and on a merger between Finnkino and SF Bio. We continue to see many attractive acquisition opportunities. During the quarter we also agreed to sell BTJ Group, which was approved at an extraordinary general meeting of Ratos in April. The growing macroeconomic anxiety during the quarter led to reduced activity in the transaction market. Among private equity funds there is a pent up need to sell companies but prob- ably more stable market conditions are required before many transactions can actually be carried out. The banks’ interest in financing transactions is increasing and there is generally good access to bank financing on good terms. Ratos has a very good position in the financing market where

  • ur long-term approach and responsible attitude are appreci-

ated by our key Nordic banking relationships.

Future prospects

Despite a weak market in the first quarter we are seeing cautious- ly optimistic signals in many areas, although no clear impact from this is expected until towards the end of the year. In the short term continued weak figures are expected from some holdings against the background of low order bookings in the first quarter, for building materials related operations for example. As in Ratos’s most recent report, the assessment is that gradually improving market conditions, combined with action taken and lower costs affecting comparability, will create condi- tions for increased profits in Ratos’s holdings overall for 2013, with the main emphasis on the second half. Susanna Campbell, CEO

CEO comments

Additional CEO comments at www.ratos.se

slide-4
SLIDE 4

4 January – March Interim report 2013

Profit before tax for the first quarter of 2013 amounted to SEK 799m (6). The higher reported result is mainly due to the exit gain from the sale of Stofa. Earnings include

Ratos’s results

profit/share of profits from the holdings of SEK -39m (-10) and exit gains of SEK 898m (0).

SEKm 2013 Q 1 2012 Q 1 2012 Profit/share of profits before tax 1) AH Industries (69%) 1 1

  • 72

Anticimex (85%) 2) 13 51 Arcus-Gruppen (83%)

  • 79
  • 82
  • 73

Biolin Scientific (100%)

  • 1
  • 2

14 Bisnode (70%) 23 26

  • 31

Contex Group (100%)

  • 150

DIAB (96%)

  • 23
  • 19
  • 287

Euromaint (100%)

  • 42
  • 18
  • 49

Finnkino (98%) 84 23 82 GS-Hydro (100%) 8 12 44 Hafa Bathroom Group (100%) 9 5 HL Display (99%) 16 19 70 Inwido (97%)

  • 36
  • 30

246 Jøtul (61%)

  • 36
  • 36
  • 160

KVD Kvarndammen (100%) 3 10 25 Lindab (11%) 3)

  • 5

4 Mobile Climate Control (100%) 6 13 67 SB Seating (85%) 36 24 97 Stofa (99%) 4) 1 32 88 T

  • tal profit/share of profits
  • 39
  • 10
  • 29

Exit Anticimex 897 Exit Lindab 81 Exit Stofa 898 T

  • tal exit result

898 978 Impairment AH Industries

  • 275

Impairment Jøtul

  • 100

Profit from holdings 859

  • 10

574 Central income and expenses Management costs

  • 96
  • 54
  • 54 5)

Financial items 36 70 247 Consolidated profit before tax 799 6 767

1) Subsidiaries’ profits included with 100% and associates’ profits with respective holding percentage. 2) Anticimex is included in consolidated profit through June 2012. The entire holding was sold in July 2012. 3) Lindab is included in consolidated profit through June 2012. The entire holding was sold in August 2012. 4) Stofa is included in consolidated profit through January 2013. The entire holding was sold in February 2013. 5) Management costs include a SEK 168m capital gain which relates to an earlier intra-group sale of a group company

where the gain was recognised when this company left the Group in 2012.

slide-5
SLIDE 5

5 January – March Interim report 2013

Central income and expenses

Ratos’s central income and expenses amounted to SEK -60m (16), of which personnel costs in Ratos AB amounted to SEK 48m (33). The variable portion of personnel costs amount- ed to SEK 25m (9). Other management costs were SEK 48m (21). Net financial items amounted to SEK +36m (+70).

Tax

Ratos’s consolidated tax expense comprises subsidiaries’ and Ratos’s share of tax in associates. The tax rate in consolidated profit or loss is affected, among other things, by the parent company’s investment company status and by capital gains not liable to tax.

Financial position

Cash flow from operating activities and investing activities was SEK 64m (686) and consolidated cash and cash equivalents at the end of the period was SEK 3,956m (3,338), of which short- term interest-bearing investments accounted for SEK 1,114m (266). Interest-bearing liabilities including pension provisions amounted to SEK 11,333m (13,839).

Parent company

The parent company’s loss before tax amounted to SEK 55m (2). The parent company’s cash and cash equivalents, includ- ing short-term interest-bearing investments, was SEK 2,934m (1,734). Taking into account financial transactions carried out after the end of the period, at 8 May Ratos has a net liquid- ity of approximately SEK 50m. In addition, there is an existing credit facility of SEK 3.2 billion, authorisation from the 2013 Annual General Meeting to issue 35 million Ratos B shares in conjunction with agreements on acquisitions and an authorisa- tion to issue a maximum of 1,250,000 preference shares in conjunction with agreements on acquisitions.

Risks and uncertainties

A description of the Group’s and parent company’s material risks and uncertainties is provided in the Directors’ report and in Notes 31 and 38 in the 2012 Annual Report. An assessment for the coming months is provided in the CEO comments on performance in the first quarter section on page 3.

Related-party transactions

The parent company received dividends and repayments of shareholder contributions from subsidiaries and associates of SEK 49m (990). Capital contribution to be provided to Jøtul of approximately SEK 40m.

Ratos shares

Earnings per share before dilution amounted to SEK 2.53 (0). The total return on Ratos shares in the first quarter of 2013 amounted to 10%, compared with the performance of the SIX Return Index which was 10%.

Treasury shares and number of shares

No shares were repurchased and no call options were exer- cised in the first quarter of 2013. 4,660 shares were transferred to administrative employees in accordance with an AGM reso-

  • lution. At the end of March, Ratos owned 5,134,887 B shares

(corresponding to 1.6% of the total number of shares), repur- chased at an average price of SEK 69. At 31 March the total number of shares in Ratos (A and B shares) amounted to 324,140,896 and the number of votes was 108,587,443.6. The number of outstanding shares was 319,006,019. The average number of B treasury shares in Ratos in the first quarter of 2013 was 5,138,228 (5,140,203 in the full year 2012).

  • 60
  • 40
  • 20

20 40 60 80 100 2012 2011 2010 2009 2008

Ratos B SIX Return Index

%

T

  • tal return

1 January 2008 – 31 March 2013

slide-6
SLIDE 6

6 January – March Interim report 2013

Ratos’s equity 1)

At 31 March 2013 Ratos’s equity (attributable to owners of the parent) amounted to SEK 12,910m (SEK 12,405m at 31 December 2012), corresponding to SEK 40 per outstanding share (SEK 39 at 31 December 2012).

Credit facilities

The parent company has a five-year rolling credit facility of SEK 3.2 billion including a bank overdraft facility. The purpose

  • f the facility is to be able to use it when bridge financing is

required for acquisitions and to be able to finance dividends and day-to-day running costs in period of few or no exits. The parent company should normally be unleveraged. The credit facility was unutilised at the end of the period.

Annual General Meeting resolutions

Election of Board of Directors and auditors

The Meeting resolved in accordance with the Nomination Committee’s proposal to re-elect Board members Lars Berg, Staffan Bohman, Arne Karlsson, Annette Sadolin, Jan Söderberg, Per-Olof Söderberg and Margareth Øvrum. Arne Karlsson was elected as Chairman of the Board. The Meeting also elected PricewaterhouseCoopers AB as auditors for the period until the next Annual General Meeting has been held.

Dividend ordinary shares

The Meeting resolved on an ordinary dividend of SEK 3 per share (5.50). The record date for dividends was set at 22 April and payments from Euroclear Sweden were made on 25 April 2013.

Purchase of treasury shares

The Meeting gave the Board a mandate to decide, during the period before the next Annual General Meeting, on repurchase

  • f a maximum number of shares so that the company’s holding
  • f treasury shares does not at any time exceed 4% of all the

shares in the company. At a subsequent statutory meeting, the Board decided to give the CEO, in consultation with the Chairman, a mandate to carry out repurchases in accordance with the mandate given to the Board by the Annual General Meeting.

Incentive programmes

The Meeting resolved to issue a maximum of 800,000 call

  • ptions on repurchased treasury shares to be transferred to

key people in Ratos at a market premium. The Meeting further resolved to transfer a maximum of 800,000 shares in the

SEKm 31 March 2013 % of equity AH Industries 297 2 Arcus-Gruppen 394 3 Biolin Scientific 330 3 Bisnode 1,146 9 DIAB 885 7 Euromaint 533 4 Finnkino 504 4 GS-Hydro 1 Hafa Bathroom Group 154 1 HL Display 1,043 8 Inwido 2,201 17 Jøtul 155 1 KVD Kvarndammen 255 2 Mobile Climate Control 813 6 SB Seating 1,106 9 T

  • tal

9,817 76 Other net assets in central companies 3,093 24 Equity (attributable to owners of the parent) 12,910 100 Equity per share, SEK 40

1) Holdings are shown at consolidated figures, which correspond to the Group’s share of the holdings’ equity, any residual values on consolidated surplus and

deficit values minus any intra-group profits. Shareholder loans and interest on such loans are also included.

slide-7
SLIDE 7

7 January – March Interim report 2013

company in conjunction with exercise of the above-mentioned

  • ptions.

The Meeting further resolved, as in the previous year, on a cash-settled option programme related to the company’s investments in the portfolio companies. The programme will be carried out through issuance of synthetic options which key people within Ratos will be entitled to acquire. The Meeting also resolved to transfer a maximum of 16,000 Ratos B shares to administrative employees.

Authorisation for new issues to be used at acquisitions

The Meeting resolved to authorise the Board, during the period until the next Annual General Meeting, in conjunction with agreements on company acquisitions, on one or more occa- sions, with or without deviation from the pre-emptive rights of shareholders, against cash payment, through set-off or non- cash, to make a decision on a new issue of class B shares in the company. This authorisation shall comprise a maximum of 35 million class B shares.

Authorisation for new issue of preference shares to be used at acquisitions

The Meeting resolved to authorise the Board, during the period until the next Annual General Meeting, in conjunction with agreements on company acquisitions, on one or more occa- sions, with or without deviation from the pre-emptive rights

  • f shareholders, against cash payment, through set-off or

non-cash, to make a decision on a new issue of class C prefer- ence shares. This authorisation shall comprise a maximum of 1,250,000 class C preference shares. The Meeting further resolved on an amendment to the Articles of Association in order to enable a new issue of class C preference shares, with a quarterly dividend of SEK 25 per preference share, however a maximum of SEK 100 per year.

slide-8
SLIDE 8

8 January – March Interim report 2013

Holdings

AH Industries

■ Sales SEK 254m (287) and EBITA SEK 6m (9) ■ Weak sales development within Wind Solutions, although a

recovery compared with the fourth quarter of 2012. Con- tinued strong trend for Industrial Solutions which increased sales sharply compared with the first quarter last year

■ Knud Andersen new CEO from 15 May 2013 ■ Major focus on cost-cutting programmes due to continued

weak market prospects for the wind energy industry in the short term AH Industries is a world-leading supplier of metal components, modules and systems to the wind energy and cement and miner- als industries. The company is specialised in the manufacture and machining of heavy metal components with high precision require-

  • ments. The company has production facilities in Denmark, China

and Germany. Ratos’s holding in AH Industries amounted to 69% and the consolidated book value in Ratos was SEK 297m at 31 March 2013.

More information about the holdings and a summary of income statements and statements of financial position for Ratos’s holdings is available in downloadable Excel files at www.ratos.se.

Arcus-Gruppen

■ Sales SEK 512m (486) and EBITA SEK -22m (-56) ■ Organic growth -3%. Good sales and earnings growth

within spirits due to the acquisition of Aalborg and other brands

■ Adjusted EBITA amounted to SEK -7m (4). Lower earnings

due to ongoing restructuring of distribution operations as well as integration costs

■ Acquisition of the brands Aalborg, Brøndums, Gammel

Dansk and Malteser was completed in January 2013. A sales process for Brøndums is underway to meet the require- ments of the competition authorities Arcus-Gruppen is Norway’s leading spirits producer and one of the largest wine suppliers in the Nordic region through Vingruppen, Vinordia and Arcus Wine Brands. The group’s best-known brands include Aalborg Akvavit, Braastad Cognac, Gammel Dansk, Lysholm Linie Aquavit and Vikingfjord Vodka. Ratos’s holding in Arcus-Gruppen amounted to 83% and the consolidated book value in Ratos was SEK 394m at 31 March 2013.

Biolin Scientific

■ Sales SEK 50m (49) and EBITA SEK -2m (-1) ■ 8% sales growth in local currency ■ EBITA adjusted for costs affecting comparability amounted

to SEK 1m (-1)

■ Good development for Discovery Instruments (Sophion)

and Diagnostic Instruments (Osstell). Weak development for Analytical Instruments affected by government budget constraints in the US

■ Johan von Heijne new CEO from 1 February 2013

Biolin Scientific develops, manufactures and markets analytical instruments for research, development, quality control and clinical

  • diagnostics. The company’s largest market niche is nanotechnology,

primarily materials science, cell analysis and biophysics. Customers are found worldwide and mainly comprise researchers in universi

  • ties, research institutes and the industrial sector.

Ratos’s holding in Biolin Scientific amounted to 100% and the consolidated book value in Ratos was SEK 330m at 31 March 2013.

slide-9
SLIDE 9

9 January – March Interim report 2013

Bisnode

■ Sales SEK 925m (982) and EBITA SEK 74m (81) (pro forma

2012, adjusted for the Product Information business area)

■ Organic sales growth adjusted for currency effects was

  • 4%. The decline in sales was due to an overall weak market

and a temporary effect of an internal change programme

■ EBITA adjusted for items affecting comparability amounted

to SEK 79m (87), corresponding to an operating margin of 8.6% (8.9)

■ Efforts to create a more cohesive Bisnode are underway.

During the quarter, the 13 individual marketing companies in Sweden were placed under the Bisnode brand

■ Establishment in two more countries in Central Europe

Bisnode is a leading European provider of decision support within business, credit and market information. The customer base is companies and organisations throughout Europe which use Bisnode’s services to convert data into knowledge for both day-to- day issues and major strategic decisions. Bisnode has more than 3,000 employees in 19 countries. Ratos’s holding in Bisnode amounted to 70% and the conso- lidated book value in Ratos was SEK 1,146m at 31 March 2013.

DIAB

■ Sales SEK 208m (263) and EBITA SEK -6m (-3) ■ Reduced sales mainly due to a very weak wind energy

market in China and the US. Sales to the TIA segment developed well

■ Positive news from the Chinese energy authorities and an

extension of subsidies in the US, create conditions for a recovery in the wind energy segment during the latter part

  • f 2013

■ EBITA on par with the previous year due to implemented

cost savings. Initiated cost-cutting programme is going ac- cording to plan and expected to have a full effect in 2014 DIAB is a world-leading company that manufactures and develops core materials for composite structures including blades for wind turbines, hulls and decks for leisure boats, and components for air- craft, trains, industrial applications and buildings. The material has a unique combination of characteristics such as low weight, high strength, insulation properties and chemical resistance. Ratos’s holding in DIAB amounted to 96% and the consoli- dated book value in Ratos was SEK 885m at 31 March 2013.

Euromaint

■ Sales SEK 623m (691) and EBITA SEK -14m (10) ■ Lower sales due to weak market and loss of volume from

a customer in Germany

■ Adjusted for costs affecting comparability related to a lost

contract dispute and action programmes, adjusted EBITA amounted to SEK 19m (22)

■ Improved earnings development in Sweden. Germany

remains weak but stabilised due to completed action programmes Euromaint is one of Europe’s leading independent maintenance companies for the rail transport industry. The company’s services and products guarantee the reliability and service life of track- mounted vehicles such as freight carriages, passenger trains, loco- motives and work machines. Euromaint has operations in Sweden, Germany, Belgium, the Netherlands and Latvia. Ratos’s holding in Euromaint amounted to 100% and the consolidated book value in Ratos was SEK 533m at 31 March 2013.

slide-10
SLIDE 10

10 January – March Interim report 2013

Finnkino

■ Sales SEK 225m (225) and EBITA SEK 91m (36) ■ Sales in local currency rose 4% mainly driven by a number

  • f popular Finnish films

■ EBITA, adjusted for a SEK 51m capital gain related to the

sale of a property in Tallinn, amounted to SEK 40m (36)

■ The merger between SF Bio and Finnkino was completed at

the beginning of May Finnkino is the largest movie theatre chain in Finland and the Baltic countries with 24 movie theatres and 158 screens with a total of approximately 27,000 seats. The company also conducts film distribution and some distribution of DVDs. The movie theatre

  • perations are conducted under the name Finnkino in Finland and

Forum Cinemas in the Baltic countries. Ratos’s holding in Finnkino amounted to 98% and the consolidated book value in Ratos was SEK 504m at 31 March 2013.

GS-Hydro

■ Sales SEK 301m (320) and EBITA SEK 17m (25) ■ High level of activity and good sales in the offshore segment ■ Ongoing growth initiatives related to the development

  • f the aftermarket offering and business systems charged

against earnings for the quarter

■ Lower EBITA margin mainly due to slightly lower sales and

growth initiatives GS-Hydro is a leading supplier of non-welded piping solutions. Products are used in the marine and offshore industries as well as land-based segments such as the pulp and paper, metals and mining, and automotive and aerospace industries. The head office is located in Finland. Ratos’s holding in GS-Hydro amounted to 100% and the consolidated book value in Ratos was SEK 1m at 31 March 2013.

Hafa Bathroom Group

■ Sales SEK 64m (81) and EBITA SEK 1m (10) ■ Weak consumer market had negative impact on sales ■ Lower earnings due to lower volumes and unfavourable

sales mix

■ Action taken to adjust costs

Hafa Bathroom Group with the Hafa and Westerbergs brands is

  • ne of the Nordic region’s leading bathroom interior companies.

Ratos’s holding in Hafa Bathroom Group amounted to 100% and the consolidated book value in Ratos was SEK 154m at 31 March 2013.

HL Display

■ Sales SEK 374m (403) and EBITA SEK 24m (28) ■ Sales in local currency decreased by 4%. Lower demand in

all markets except for Northern Europe. A greater number

  • f public holidays, a continued strong Swedish krona and

postponed investments due to market uncertainty explain the lower sales

■ Retained adjusted EBITA margin despite lower sales and

currency effects due to good cost control HL Display is a global, market-leading supplier of products and systems for merchandising and in-store communication with opera- tions in 47 countries. Manufacture takes place in Poland, Sweden, China and the UK. Ratos’s holding in HL Display amounted to 99% and the con- solidated book value in Ratos was SEK 1,043m at 31 March 2013.

slide-11
SLIDE 11

11 January – March Interim report 2013

Inwido

■ Sales SEK 857m (930) and EBITA SEK -19m (-27)

(2012 pro forma for the sale of Home Improvement)

■ Organic sales growth -6% ■ Generally weak market and order bookings in most of the

Nordic region within both consumers and industry

■ Completed cost-cutting measures partly compensated for

reduced demand Inwido develops, manufactures and sells a full range of windows and exterior doors to consumers, construction companies and prefabricated home manufacturers. Operations are conducted in all the Nordic countries as well as in the UK, Ireland, Poland and

  • Russia. The company’s brands include Elitfönster, SnickarPer, Tiivi,

KPK, Lyssand and Allan Brothers. Ratos’s holding in Inwido amounted to 97% and the conso- lidated book value in Ratos was SEK 2,201m at 31 March 2013.

Jøtul

■ Sales SEK 183m (208) and EBITA SEK -21m (-25) ■ Sales in local currency decreased by 10%. More stable

demand compared with fourth quarter of 2012 and higher sales in Norway and France. A greater number of public holidays and weaker development in Sweden and the US led to lower sales, however.

■ Production situation improved and delivery ability is good,

although productivity remains weak

■ Capital contribution of approximately SEK40m after the

end of the quarter The Norwegian company Jøtul is one of Europe’s largest manu- facturer of stoves and fireplaces with production facilities in Norway, Denmark, France, Poland and the US. The company dates back to 1853 and the products are sold worldwide, primarily through speciality stores, but also through the DIY trade. Ratos’s holding in Jøtul amounted to 61% and the consoli- dated book value in Ratos was SEK 155m at 31 March 2013.

KVD Kvarndammen

■ Sales SEK 74m (78) and EBITA SEK 6m (12) ■ Very weak market for company cars (-8%) and for con-

struction machinery had a negative impact on sales in the first quarter

■ Rising volumes of cars owned by private individuals ■ Establishment costs in Norway explain most of the differ-

ence in earnings compared with the previous year KVD Kvarndammen is Sweden’s largest independent online market- place offering broker services for second-hand vehicles. The com- pany, which was founded in 1991, runs kvd.se where cars, heavy vehicles and machines are offered for sale at weekly online auctions. The number of unique visitors totals approximately 200,000 per

  • week. The company includes Sweden’s largest valuation portal for

cars, bilpriser.se. Ratos’s holding in KVD Kvarndammen amounted to 100% and the consolidated book value in Ratos was SEK 255m at 31 March 2013.

slide-12
SLIDE 12

12 January – March Interim report 2013

SB Seating

■ Sales SEK 291m (306) and EBITA SEK 61m (59) ■ Higher sales in Denmark, Finland, France, Norway and the

  • UK. Lower sales in other markets

■ Higher EBITA margin, 21% (19), due to improved opera-

tional efficiency

■ Three new products launched: HÅG SoFi, RH Mereo and

RBM Noor. Red Dot Design Award (Best of the Best) received for RBM Noor. HÅG SoFi received the Environ- mental Award from the Norwegian Design Council SB Seating develops and produces ergonomic office chairs in Scandinavian design for private and public environments. The group markets three strong brands, HÅG, RH and RBM, which are mainly sold through retail outlets. The group is represented today in Norway, Sweden, Denmark, Germany, the UK, the Netherlands and France. Ratos’s holding in SB Seating amounted to 85% and the con- solidated book value in Ratos was SEK 1,106m at 31 March 2013.

Mobile Climate Control (MCC)

■ Sales SEK 244m (286) and EBITA SEK 17m (21) ■ Adjusted for currency effects sales fell 11%. Sales were

negatively affected by generally weak market conditions in Europe as well as lower volumes in the defence vehicle segment

■ Lower earnings due to reduced sales. Retained operating

margin due to completed profitability improvement meas- ures Mobile Climate Control (MCC) offers complete climate comfort systems for three main customer segments: buses, off road and defence vehicles. Approximately 80% of the company’s sales take place in North America and 20% in Europe. Major production plants are located in Canada (Toronto), USA (Goshen) and Poland (Olawa). Ratos’s holding in Mobile Climate Control amounted to 100% and the consolidated book value in Ratos was SEK 813m at 31 March 2013.

slide-13
SLIDE 13

13 January – March Interim report 2013

Ratos’s holdings at 31 March 2013

A) EBITA excluding items affecting comparability. B) Investments excluding business combinations. C) Cash flow refers to cash flow from operating activities and investing activities before acquisition and disposal of companies. 1)

Bisnode’s earnings for 2012 are pro forma taking into account discontinued operation Product Information.

2)

Inwido’s earnings for 2012 are pro forma taking into account sale of Home Improvement. Net sales EBITA Adjusted EBITA

A)

SEKm 2013 Q 1 2012 Q 1 2012 2013 Q 1 2012 Q 1 2012 2013 Q 1 2012 Q 1 2012

AH Industries 254 287 1,062 6 9

  • 45

6 9

  • 7

Arcus-Gruppen 512 486 2,278

  • 22
  • 56

5

  • 7

4 205 Biolin Scientific 50 49 235

  • 2
  • 1

23 1

  • 1

23 Bisnode 1) 925 982 3,869 74 81 339 79 87 414 DIAB 208 263 1,003

  • 6
  • 3
  • 217
  • 6
  • 3
  • 75

Euromaint 623 691 2,489

  • 14

10 51 19 22 81 Finnkino 225 225 862 91 36 128 40 36 133 GS-Hydro 301 320 1,352 17 25 123 17 25 123 Hafa Bathroom Group 64 81 268 1 10 7 1 10 7 HL Display 374 403 1,657 24 28 104 28 30 125 Inwido 2) 857 930 4,476

  • 19
  • 27

328

  • 17
  • 4

347 Jøtul 183 208 913

  • 21
  • 25
  • 52
  • 19
  • 25
  • 52

KVD Kvarndammen 74 78 287 6 12 41 6 14 44 Mobile Climate Control 244 286 1,250 17 21 108 17 22 111 SB Seating 291 306 1,176 61 59 237 61 59 237 T

  • tal 100%

5,187 5,594 23,179 213 179 1,181 229 285 1,717 Change

  • 7%

+19%

  • 20%

T

  • tal adjusted for
  • wnership

4,583 4,950 20,544 191 162 1,072 202 256 1,534 Change

  • 7%

+18%

  • 21%

Interest-bearing Consolidated Ratos’s Depreciation Investments B) Cash flowC) net debt value

  • wnership

SEKm 2013 Q 1 2013 Q 1 2013 Q 1 31 March 2013 31 March 2013 31 March 2013

AH Industries 14 4

  • 10

392 297 69% Arcus-Gruppen 14 7

  • 222

1,427 394 83% Biolin Scientific 2 6 2 154 330 100% Bisnode 1) 29 14 48 2,080 1,146 70% DIAB 16 8

  • 6

738 885 96% Euromaint 11 3

  • 21

615 533 100% Finnkino 16 15 104 108 504 98% GS-Hydro 5 3 3 433 1 100% Hafa Bathroom Group 1 2 61 154 100% HL Display 9 8

  • 36

422 1,043 99% Inwido 2) 27 20

  • 145

1,319 2,201 97% Jøtul 15 10

  • 43

615 155 61% KVD Kvarndammen 1 1

  • 5

226 255 100% Mobile Climate Control 4 3 3 551 813 100% SB Seating 8 12 15 633 1,106 85%

slide-14
SLIDE 14

14 January – March Interim report 2013

Consolidated income statement

Financial statements

SEKm 2013 Q 1 2012 Q 1 2012 Net sales 5,461 6,822 27,100 Other operating income 85 40 171 Change in inventories 51 66

  • 32

Raw materials and consumables

  • 2,247
  • 2,705
  • 10,918

Employee benefit costs

  • 1,958
  • 2,289
  • 8,644

Depreciation and impairment of property, plant and equip- ment and intangible assets

  • 204
  • 424
  • 1,942

Other costs

  • 1,089
  • 1,466
  • 5,391

Capital gain from the sale of group companies 906 158 1,179 Capital gain from the sale of associates 81 Share of profits of associates 4

  • 1

18 Operating profit/loss 1,009 201 1,622 Financial income 31 46 154 Financial expenses

  • 241
  • 241
  • 1,009

Net financial items

  • 210
  • 195
  • 855

Profit/loss before tax 799 6 767 Tax

  • 1
  • 9
  • 224

Profit/loss for the period 798

  • 3

543 Profit/loss for the period attributable to: Owners of the parent 807

  • 1

606 Non-controlling interests

  • 9
  • 2
  • 63

Earnings per share, SEK – before dilution 2.53 0.00 1.90 – after dilution 2.53 0.00 1.90 SEKm 2013 Q 1 2012 Q 1 2012 Profit/loss for the period 798

  • 3

543 Other comprehensive income Items that will not be reclassified to profit or loss Remeasurement of defined benefit pension obligations, net

  • 33

Tax attributable to items that will not be reclassified to profit or loss 12

  • 21

Items that will be reclassified to profit or loss when specific conditions are met Translation differences for the period

  • 280
  • 48
  • 157

Change in hedging reserve for the period 15 24 40 Tax attributable to items that will be reclassified to profit or loss when specific conditions are met

  • 4
  • 6
  • 11

Other comprehensive income for the period

  • 269
  • 30
  • 128

T

  • tal comprehensive income for the period

529

  • 33

394 Total comprehensive income for the period attributable to: Owners of the parent 574

  • 34

483 Non-controlling interests

  • 45

1

  • 89

Consolidated statement of comprehensive income

slide-15
SLIDE 15

15 January – March Interim report 2013

SEKm 31 March 2013 31 March 2012 31 Dec 2012 ASSETS Non-current assets Goodwill 15,416 19,103 15,502 Other intangible assets 1,673 1,469 1,292 Property, plant and equipment 3,379 4,153 3,461 Financial assets 208 842 225 Deferred tax assets 559 638 557 T

  • tal non-current assets

21,235 26,205 21,037 Current assets Inventories 2,463 2,808 2,387 Current receivables 4,678 6,123 4,906 Cash and cash equivalents 3,956 3,338 3,203 Assets held for sale 2,054 T

  • tal current assets

11,097 12,269 12,550 T

  • tal assets

32,332 38,474 33,587 EQUITY AND LIABILITIES Equity including non-controlling interests 13,624 14,536 13,141 Non-current liabilities Interest-bearing liabilities 8,183 11,183 7,937 Non-interest bearing liabilities 719 763 760 Pension provisions 363 461 370 Other provisions 152 381 179 Deferred tax liabilities 489 660 396 T

  • tal non-current liabilities

9,906 13,448 9,642 Current liabilities Interest-bearing liabilities 2,787 2,195 2,489 Non-interest bearing liabilities 5,890 7,502 6,413 Provisions 125 793 138 Liabilities attributable to assets held for sale 1,764 T

  • tal current liabilities

8,802 10,490 10,804 T

  • tal equity and liabilities

32,332 38,474 33,587

Summary consolidated statement of financial position

slide-16
SLIDE 16

16 January – March Interim report 2013

31 March 2013 31 March 2012 31 Dec 2012 Owners

  • f the

parent Non- controlling interests T

  • tal

equity Owners

  • f the

parent Non- controlling interests T

  • tal

equity Owners

  • f the

parent Non- controlling interests T

  • tal

equity SEKm Opening equity 12,353 788 13,141 13,658 997 14,655 13,658 997 14,655 Changed accounting principle

  • 36
  • 9
  • 45
  • 36
  • 9
  • 45

Adjusted equity 12,353 788 13,141 13,622 988 14,610 13,622 988 14,610 T

  • tal comprehensive

income for the period 574

  • 45

529

  • 34

1

  • 33

483

  • 89

394 Dividend

  • 22
  • 22
  • 40
  • 40
  • 1,754
  • 75
  • 1,829

New issue 1 1 17 17 Sale of treasury shares in associates 6 6 Option premiums 5 5 Acquisition of shares in subsidiary from non- controlling interests

  • 17
  • 4
  • 21
  • 4
  • 9
  • 13
  • 9
  • 7
  • 16

Non-controlling interests at acquisition 11 11 1 1 Non-controlling interests in disposals

  • 3
  • 3
  • 47
  • 47

Closing equity 12,910 714 13,624 13,584 952 14,536 12,353 788 13,141

Statement of changes in consolidated equity

slide-17
SLIDE 17

17 January – March Interim report 2013

SEKm 2013 Q 1 2012 Q 1 2012 Operating activities Profit before tax 799 6 767 Adjustment for non-cash items

  • 597

282 927 202 288 1,694 Income tax paid

  • 95
  • 133
  • 260

Cash flow from operating activities before change in working capital 107 155 1,434 Cash flow from change in working capital Increase (-)/Decrease (+) in inventories 1

  • 126

120 Increase (-)/Decrease (+) in operating receivables 148 66 416 Increase (+)/Decrease (-) in operating liabilities

  • 688
  • 526
  • 861

Cash flow from operating activities

  • 432
  • 431

1,109 Investing activities Acquisition, group companies

  • 801
  • 14
  • 53

Disposal, group companies 1,337 1,373 2,915 Acquisition, shares in associates

  • 2

Disposal, shares in associates 386 Acquisition, other intangible/tangible assets

  • 126
  • 185
  • 898

Disposal, other intangible/tangible assets 51 5 65 Investment, financial assets

  • 22
  • 63
  • 37

Disposal, financial assets 57 1 35 Cash flow from investing activities 496 1,117 2,411 Financing activities Exercise of options

  • 13

Option premiums 17 Acquisition of shares in subsidiary from non-controlling interests

  • 19
  • 14
  • 21

Incentive programmes

  • 88

Dividend paid

  • 1,754

Dividend paid/redemption, non-controlling interests

  • 22
  • 40
  • 75

Borrowings 1,169 629 1,596 Amortisation of loans

  • 394
  • 964
  • 3,025

Cash flow from financing activities 646

  • 389
  • 3,275

Cash flow for the period 710 297 245 Cash and cash equivalents at beginning of the year 3,203 3,042 3,042 Exchange differences in cash and cash equivalents

  • 29
  • 1
  • 10

Cash and cash equivalents attributable to assets held for sale 72

  • 74

Cash and cash equivalents at the end of the period 3,956 3,338 3,203

Consolidated statement of cash flows

slide-18
SLIDE 18

18 January – March Interim report 2013

SEKm 2013 Q 1 2012 Q 1 2012 Return on equity, % 5 Equity ratio, % 42 38 39 Key figures per share Total return, % 10 14

  • 17

Dividend yield, % 4,8 Market price, SEK 68.85 91.85 62.50 Dividend, SEK 3 Equity attributable to owners of the parent, SEK 40 43 39 Earnings per share before dilution, SEK 2.53 0.00 1.90 Average number of shares outstanding – before dilution 319,002,668 318,998,656 319,000,693 – after dilution 319,002,668 318,998,656 319,008,267 Total number of registered shares 324,140,896 324,140,896 324,140,896 Number of shares outstanding 319,006,019 319,001,359 319,001,359 – of which A shares 84,637,060 84,637,060 84,637,060 – of which B shares 234,368,959 234,364,299 234,364,299

Consolidated key figures

slide-19
SLIDE 19

19 January – March Interim report 2013

SEKm 2013 Q 1 2012 Q 1 2012 Other operating income 1 2 Other external costs

  • 20
  • 17
  • 82

Personnel costs

  • 48
  • 33
  • 119

Depreciation of property, plant and equipment

  • 1
  • 1
  • 5

Operating profit/loss

  • 69
  • 50
  • 204

Capital gain from sale of investments in group companies 830 Dividends from group companies 49 382 Impairment of shares in group companies

  • 796

Capital gain from sale of interests in associates 266 Dividends from associates 5 14 Impairment of interests in associates

  • 5

Result from other securities and receivables accounted for as non-current assets 35 41 137 Other interest income and similar profit/loss items 7 17 33 Interest expenses and similar profit/loss items

  • 77
  • 15
  • 51

Profit/loss after financial items

  • 55
  • 2

606 Tax Profit/loss for the period

  • 55
  • 2

606

Parent company income statement Parent company statement of comprehensive income

SEKm 2013 Q 1 2012 Q 1 2012 Profit/loss for the period

  • 55
  • 2

606 Other comprehensive income Change in fair value reserve for the period

  • 70

1

  • 13

Other comprehensive income for the period

  • 70

1

  • 13

T

  • tal comprehensive income for the period
  • 125
  • 1

593

slide-20
SLIDE 20

20 January – March Interim report 2013

Summary parent company balance sheet

SEKm 31 March 2013 31 March 2012 31 Dec 2012 ASSETS Non-current assets Property, plant and equipment 77 81 78 Financial assets 10,137 11,679 10,235 T

  • tal non-current assets

10,214 11,760 10,313 Current assets Current receivables 149 82 20 Short-term investments 1,114 499 Cash and cash equivalents 1,820 1,734 1,324 T

  • tal current assets

3,083 1,816 1,843 T

  • tal assets

13,297 13,576 12,156 EQUITY AND LIABILITIES Equity 11,260 12,540 11,385 Non-current provisions Pension provisions 1 1 1 Other provisions 7 16 7 Non-current liabilities Interest-bearing liabilities, group companies 479 820 442 Non-interest bearing liabilities 32 31 29 Current provisions 9 21 28 Current liabilities Interest-bearing liabilities, group companies 1,372 50 174 Non-interest bearing liabilities 137 97 90 T

  • tal equity and liabilities

13,297 13,576 12,156 Pledged assets and contingent liabilities none none none SEKm 31 March 2013 31 March 2012 31 Dec 2012 Opening equity 11,385 12,541 12,541 T

  • tal comprehensive income for the period
  • 125
  • 1

593 Dividend

  • 1,754

Purchase of treasury shares Transfer of treasury shares (exercise call options) Option premiums 5 Closing equity 11,260 12,540 11,385

Summary statement of changes in parent company’s equity

slide-21
SLIDE 21

21 January – March Interim report 2013

SEKm 2013 Q 1 2012 Q 1 2012 Operating activities Profit before tax

  • 55
  • 2

606 Adjustment for non-cash items

  • 40
  • 42
  • 700
  • 95
  • 44
  • 94

Income tax paid – – – Cash flow from operating activities before change in working capital

  • 95
  • 44
  • 94

Cash flow from change in working capital Increase (-)/Decrease (+) in operating receivables

  • 119
  • 14
  • 23

Increase (+)/Decrease (-) in operating liabilities 26 4

  • 21

Cash flow from operating activities

  • 188
  • 54
  • 138

Investing activities Investment, shares in subsidiaries

  • 172
  • 260
  • 381

Disposal and redemption, shares in subsidiaries 117 846 2,740 Disposal, shares in associates and other holdings 385 Acquisition, property, plant and equipment

  • 1

Investment, financial assets

  • 77
  • 20
  • 145

Disposal, financial assets 16 75 103 Cash flow from investing activities

  • 116

641 2,701 Financing activities Option premiums 5 Redemption incentive programme

  • 20
  • 5

Dividend paid

  • 1,754

Loans raised in group companies 1,435 250 117 Cash flow from financing activities 1,415 250

  • 1,637

Cash flow for the period 1,111 837 926 Cash and cash equivalents at the beginning of the year 1,823 897 897 Cash and cash equivalents at the end of the period 2,934 1,734 1,823

Parent company cash flow statement

slide-22
SLIDE 22

22 January – March Interim report 2013

Note 1

Accounting principles in accordance with IFRS

The consolidated financial statements are prepared in accordance with International Financial Reporting Standards (IFRS). The interim report is prepared in accordance with IAS 34, Interim Financial Reporting. Pertinent regulations in the Swedish Annual Accounts Act are also applied. The parent company’s interim report is prepared in accordance with the Annual Accounts Act which is in accordance with the regulations in RFR 2 Accounting for Legal Entities. IFRS requires uniform accounting principles within a group. The ac- counting principles and basis of calculation are the same as those applied for the Group and the parent company in preparation of the most recent annual report.

New accounting principles for 2013

The revised IFRS standards which come into force in 2013 are not assessed as having any material effect on the performance, financial position or disclosures of the Group or parent company. IAS 19 – Employee Benefits New IAS 19 represents changes relating to recognition of defined benefit pension plans. The amendments mean that the present value of the defined benefit obligations are in their entirety booked in the statement of financial position since the possibility to defer actuarial gains and losses over time as part of the so-called corridor rule may no longer be applied. Going forward these are to be reported in other comprehensive income. The net pension liability will in future be calculated on the basis of the discount rate for pension provisions. Previously the anticipated return on plan assets and the discount rate were used to calculate the interest expense related to pension obligations. The net amount affects equity as a change in accounting principles as per 1 January 2012. Subsequently actuarial gains and losses are recognised in other comprehensive income. The total effect on the Ratos Group’s equity amounts to SEK -66m after tax, which is divided among adjustment

  • f opening balance of SEK -45m after tax and SEK -21m after tax in other

comprehensive income in 2012. The difference from the previously stated amount, SEK -114m, is mainly due to effects of sold companies and a trans- fer to defined contribution pension plans. IAS 1 – Presentation of Financial Statements The consolidated statement of comprehensive income have been divided into items that in future can, or cannot, be reclassified to profit or loss. The statement also includes, following introduction of amended IAS 19, a separate line for remeasurement of defined benefit pensions. IFRS 13 – Fair Value Measurement This standard defines fair value when another IFRS requires fair value meas-

  • urements. It also provides guidance on valuation techniques and a require-

ment for more detailed disclosures. The introduction of this standard is not expected to have a significant effect on Ratos’s fair value calculation where these are used in the financial statements or where disclosures on fair value are to be made. For disclosures on financial instruments which must be provided quarterly from 2013, see Note 4. IAS 34 – Interim Financial Reporting The amendment entails a requirement for disclosures according to changed standards as set out above as well as disclosures on financial instruments according to IFRS 7 which were previously provided annually, see Note 4. IFRS 7 – Financial Instruments: Disclosures The amendment relates to disclosure requirements relating to offsetting of financial assets and liabilities as well as potential netting effects in the event

  • f binding master agreements.

Acquisitions

Acquisitions after the end of the reporting period The acquisition of Aibel announced in December was completed in April. Enterprise value for 100% of Aibel amounted to NOK 8,600m. Ratos acquired 32% of the company and provided equity of NOK 1,429m (approximately SEK 1,680m). In March, Ratos signed an agreement with Bonnier on a merger of SF Bio and Finnkino. The new group will be owned to approximately 60% by Ratos and 40% by Bonnier. The acquisition was completed at the begin- ning of May and did not involve any capital contribution from Bonnier or from Ratos. In March, Ratos, together with Rite Ventures and the company’s man- agement, signed an agreement to acquire Nebula Oy. The acquisition was completed in April. The purchase price (enterprise value) for 100% of the company amounted to EUR 82.5m (approximately SEK 700m), of which Ratos provided equity of EUR 35m (approximately SEK 300m) for a hold- ing corresponding to 72%. An earn-out may be paid if certain profitability milestones are achieved. Acquisitions in subsidiaries In July 2012, Arcus-Gruppen signed an agreement to acquire the brands Aalborg, Brøndums, Gammel Dansk and Malteser from Pernod Ricard. The purchase price (enterprise value) amounted to EUR 103m. The ac- quisition was completed in January 2013. In the preliminary purchase price allocation trademarks amount to SEK 447m and goodwill to SEK 361m. A sales process for Brøndums is underway as required by the competition authorities. SEKm Intangible assets 447 Property, plant and equipment 121 Current assets 42 Cash and cash equivalents 130 Deferred tax

  • 122

Current liabilities

  • 53

Net identifiable assets and liabilities 565 Consolidated goodwill 361 Consideration transferred 926 The purchase price allocation is preliminary, which means that fair value is not finally identified for all items.

Disposals

In October 2012, Ratos signed an agreement on the sale of all the shares in the subsidiary Stofa to the Danish energy and telecom group SE (Syd Energi). The sale was completed in February 2013. Consideration trans- ferred amounted to SEK 1,204m and the capital gain for Ratos (exit gain) amounted to SEK 898m. Disposals in subsidiaries Ratos’s subsidiary Contex Group sold its subsidiary Contex A/S to the private equity fund Procuritas. The sale was completed in January 2013. Consideration transferred amounted to SEK 219m and the capital gain for Contex Group amounted to SEK 0m.

Note 2

Business combinations

slide-23
SLIDE 23

23 January – March Interim report 2013

Operating segments

Note 3

Sales EBT 1) SEKm 2013 Q 1 2012 Q 1 2012 2013 Q 1 2012 Q 1 2012 Holdings AH Industries 254 287 1,062 1 1

  • 72

Anticimex 2) 486 1,009 13 51 Arcus-Gruppen 512 486 2,278

  • 79
  • 82
  • 73

Biolin Scientific 50 49 235

  • 1
  • 2

14 Bisnode 925 1,033 3,935 23 26

  • 31

Contex Group 85 286

  • 150

DIAB 208 263 1,003

  • 23
  • 19
  • 287

Euromaint 623 691 2,489

  • 42
  • 18
  • 49

Finnkino 225 225 862 84 23 82 GS-Hydro 301 320 1,352 8 12 44 Hafa Bathroom Group 64 81 268 9 5 HL Display 374 403 1,657 16 19 70 Inwido 857 1,005 4,607

  • 36
  • 30

246 Jøtul 183 208 913

  • 36
  • 36
  • 160

KVD Kvarndammen 74 78 287 3 10 25 Lindab 3)

  • 5

4 Mobile Climate Control 244 286 1,250 6 13 67 SB Seating 291 306 1,176 36 24 97 Stofa 4) 131 393 1,572 1 32 88 T

  • tal

5,318 6,685 26,241

  • 39
  • 10
  • 29

Exit Anticimex 897 Exit Lindab 81 Exit Stofa 898 Exit result 898 978 Impairment AH Industries

  • 275

Impairment Jøtul

  • 100

Holdings total 5,318 6,685 26,241 859

  • 10

574 Central income and expenses 144 137 859

  • 60

16 193 Group total 5,461 6,822 27,100 799 6 767

1) Subsidiaries’ profits included with 100% and associates’ profits with respective holding percentage. 2) Anticimex is included in consolidated profit through June 2012. The entire holding was sold in July 2012. 3) Lindab is included in consolidated profit through June 2012. The entire holding was sold in August 2012. 4) Stofa is included in consolidated profit through January 2013. The entire holding was sold in February 2013.

Valuation techniques are unchanged during the period. Ratos applies fair value measurements to a limited extent and mainly for derivatives and synthetic options. These items are measured according to levels two and three respectively in the fair value hierarchy. In the statement of financial position at 31 March the value of deriva- tives amounts to approximately SEK 100m, recognised as a liability, and synthetic options to SEK 132m, of which SEK 22m was charged against earnings for the period.

Financial instruments

Note 4

Ratos’s assessment is that the carrying amounts of both trade receivables and trade payables comprise the fair values on the balance sheet date, as is the case with consolidated cash and cash equivalents. Ratos measures its interest-bearing liabilities at amortised cost accord- ing to the effective interest method. Ratos’s assessment is that this value, among other things depending on loan terms, corresponds to fair value on the balance sheet date.

slide-24
SLIDE 24

24 January – March Interim report 2013

Stockholm, 8 May 2013 Ratos AB (publ) Susanna Campbell

CEO

T elephone conference 8 May 10.00 CET +46 8-505 201 10

Access code: Ratos

Financial calendar 2013 15 Aug Interim report January – June 8 Nov Interim report January – September CEO’s comments CEO Susanna Campbell comments on the interim report at www.ratos.se

Drottninggatan 2 Box 1661 SE-111 96 Stockholm T el +46 8 700 17 00 Fax 08-10 25 59 www.ratos.se Reg. no. 556008-3585

Ratos is a private equity conglomerate. The company’s mission is to maximise shareholder value over time through the professional, active and responsible exercise of its ownership role in primarily medium to large unlisted Nordic companies. Ratos’s holdings include AH Industries, Aibel, Arcus-Gruppen, Biolin Scientific, Bisnode, DIAB, Euromaint, GS-Hydro, Hafa Bathroom Group, HL Display, Inwido, Jøtul, KVD Kvarndammen, Mobile Climate Control, Nebula, Nordic Cinema Group and SB Seating. Ratos is listed on Nasdaq OMX Stockholm and market capitalisation amounts to approximately SEK 20 billion.

For further information, please contact: Susanna Campbell, CEO, +46 8 700 17 00 Emma Rheborg, Head of Corporate Communications and IR, +46 8 700 17 20 This information is disclosed pursuant to the Swedish Securities Market Act, the Swedish Financial Instruments Trading Act or requirements stipulated in the listing agreement.

Introduction We have reviewed this report for the period 1 January 2013 to 31 March 2013 for Ratos AB (publ.). The Board of Directors and the CEO are responsible for the preparation and presentation of this interim report in accordance with IAS 34 and the Swedish Annual Accounts Act. Our responsibility is to express a conclusion on this interim report based on our review. Scope of Review We conducted our review in accordance with the Swedish Standard on Review Engagements SÖG 2410, Review of Interim Report Performed by the Independent Auditor of the Entity. A review consists of making inquiries, primarily of persons responsible for financial and accounting matters, and applying analytical and other review procedures. A review

Report of review of interim financial information

is substantially less in scope than an audit conducted in accordance with International Standards on Auditing, ISA, and other generally accepted auditing standards in Sweden. The procedures performed in a review do not enable us to obtain assurance that we would become aware of all significant matters that might be identified in an audit. Accordingly, we do not express an audit opinion. Conclusion Based on our review, nothing has come to our attention that causes us to believe that the interim report is not prepared, in all material respects, in accordance with IAS 34 and the Swedish Annual Accounts Act, regarding the Group, and with the Swedish Annual Accounts Act, regarding the Parent Company. Stockholm, 8 May 2013 PricewaterhouseCoopers AB Peter Clemedtson Jeanette Skoglund

Authorised Public Accountant Authorised Public Accountant Senior Auditor This interim report has been prepared in Swedish and translated into English. In the event of any discrepancies between the Swedish and the translation, the former shall take precedence.