Public Schools and the 2017-18 State Budget and Beyond March 2017 - - PDF document

public schools and the 2017 18 state budget and beyond
SMART_READER_LITE
LIVE PREVIEW

Public Schools and the 2017-18 State Budget and Beyond March 2017 - - PDF document

3/20/2017 Public Schools and the 2017-18 State Budget and Beyond March 2017 www.nyscoss.org 1 The State Budget The State Budget The State Budget The State Budget Big Picture, Looking Ahead Big Picture, Looking


slide-1
SLIDE 1

3/20/2017 1

1

Public Schools and the 2017-18 State Budget – and Beyond…

March 2017

www.nyscoss.org

2

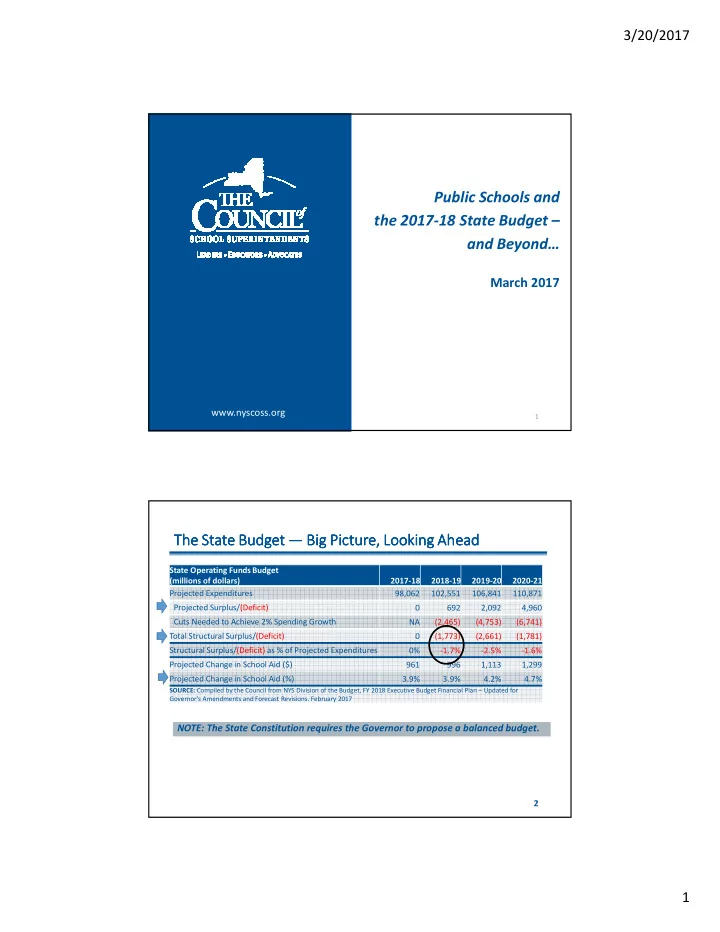
The State Budget The State Budget The State Budget The State Budget — — — — Big Picture, Looking Ahead Big Picture, Looking Ahead Big Picture, Looking Ahead Big Picture, Looking Ahead

State Operating Funds Budget (millions of dollars) 2017-18 2018-19 2019-20 2020-21 Projected Expenditures 98,062 102,551 106,841 110,871 Projected Surplus/(Deficit) 692 2,092 4,960 Cuts Needed to Achieve 2% Spending Growth NA (2,465) (4,753) (6,741) Total Structural Surplus/(Deficit) (1,773) (2,661) (1,781) Structural Surplus/(Deficit) as % of Projected Expenditures 0%

  • 1.7%
  • 2.5%
  • 1.6%

Projected Change in School Aid ($) 961 996 1,113 1,299 Projected Change in School Aid (%) 3.9% 3.9% 4.2% 4.7%

SOURCE: Compiled by the Council from NYS Division of the Budget, FY 2018 Executive Budget Financial Plan – Updated for Governor’s Amendments and Forecast Revisions. February 2017

NOTE: The State Constitution requires the Governor to propose a balanced budget.

slide-2
SLIDE 2

3/20/2017 2

Two “big picture” budget issues Two “big picture” budget issues Two “big picture” budget issues Two “big picture” budget issues

  • The Governor proposes to extend the “millionaire’s tax” now due to

expire after 12/31/2017

  • Would keep top rate at 8.82% for single taxpayers with incomes over $1

million ($2 million for married); would drop to 6.85% otherwise

  • Without extension, state would forego $683 million in 2017-18 (1 quarter)

and $3.4 billion in 2018-19 (full year)

  • Contingency language:
  • Several large appropriations– including School Aid – include language

providing that in the event that receipts come in less than budgeted, the Budget Director would be authorized to reduce amounts available for payment by a uniform percentage

  • Arises from concerns over possible federal actions – e.g., repeal of the

Affordable Care Act could cost the state $3.7 billion

3

The State Budget The State Budget The State Budget The State Budget — — — — Big Picture, Looking Back Big Picture, Looking Back Big Picture, Looking Back Big Picture, Looking Back

Education and Medicaid have fared better than most budget areas Education and Medicaid have fared better than most budget areas Education and Medicaid have fared better than most budget areas Education and Medicaid have fared better than most budget areas

4

!"#"$% 2012-13 2013-14 2014-15 2015-16 2016-17 2017-18 Projected School Aid 1.9% 1.5% 7.1% 8.1% 6.5% 4.0% Medicaid 3.7% 2.2% 3.0% 3.7% 4.2% 5.9% All else 1.5% 1.4%

  • 0.6%
  • 1.0%
  • 0.6%
  • 0.2%

Total Budget 2.0% 1.6% 1.8% 2.0% 2.0% 1.9%

  • 2%

0% 2% 4% 6% 8% 10% % change over prior year

% Change in Major State Operating Funds Areas

slide-3
SLIDE 3

3/20/2017 3

A possible narrative…

Read the report here:

http://www.nyscoss.org/img/uploads/Press_ Releases/2016-Finance-Survey-Report- FINAL_1.pdf

slide-4
SLIDE 4

3/20/2017 4

  • 7

!!" #$" %" &" %" #" '&" %!" !(" !&" #%" #'" !&" %#" '#" ')" '#" '&" !" )" #'" #*" !(" !*" #" #" #" &" %" $" #$" !$" &$" %$" '$" )$" *$" ($" +$" #$$" !$## !$#! !$#& !$#% !$#' !$#)

  • ,
  • Last year (2015)

was the 1st that more superintendents responded “better” than “worse.” Continued this year.

  • 8

!" )" #'" #*" !(" !*" #" #" #" &" %" $" #$" !$" &$" %$" '$" )$" *$" ($" +$" #$$" !$## !$#! !$#& !$#% !$#' !$#)

  • ,
  • But, still no more

than 1/3rd of superintendents Have ever responded that their district’s financial condition has improved.

slide-5
SLIDE 5

3/20/2017 5

  • .&

/

9 )" 1

  • #+"
  • '&"
  • #+"

1

  • #"

#"

  • !"#
  • !$#'2#)
  • 3"
  • "

, 45 6 ,7 3"

  • &

'()*(+ $%& %"& %"& %"& & "%& %"& $%!& %!& !%$& %"& "% & % & ,"%$& %!& !%& %& ,%$& %!& !%& %&

  • '+5!"

$5*" )5+" !5!" "82) 9

  • ,&

,!& .!&'(/(+ 012-#320 450

Near Near Near Near-

  • term, long

term, long term, long term, long-

  • term divergence

term divergence term divergence term divergence

  • Poorer districts tend to be more positive about this year, more pessimistic

looking ahead. With more affluent districts, the reverse was true.

  • Probably reflective of differences in primary revenue source:

10

slide-6
SLIDE 6

3/20/2017 6

Which issues cause concern in thinking about the Which issues cause concern in thinking about the Which issues cause concern in thinking about the Which issues cause concern in thinking about the financial outlook for your district? financial outlook for your district? financial outlook for your district? financial outlook for your district?

11

A concern Greatest concern Inadequate state aid 91% 44% The tax cap 89% 28% Increasing needs of students (e.g., increasing student poverty or increasing numbers of English Language Learners, recently arrived immigrant children, or students with disabilities) 78% 10% Expected increases in fixed or hard to control costs (e.g., pensions, health insurance) 76% 9% Declining student enrollment 47% 5% Other (Please specify) 10% 2% Increasing student enrollment 5% 0% Poor or uncertain community support for the schools 10% 0%

Student needs have been increasing… Student needs have been increasing… Student needs have been increasing… Student needs have been increasing…

12

  • 100%
  • 80%
  • 60%
  • 40%
  • 20%

0% 20% 40% 60% 80% 100%

  • 60%
  • 40%
  • 20%

0% 20% 40% 60% Percent change in FRPL (2003-05 average to 2012-14 average) Percent change in Enrollment ( 2007 to 2015)

Percent change in enrollment and K-6 pupils eligible for Free/Reduced Price Lunch Program since Foundation Aid was enacted (2007)

Lost enrollment, gained FRPL pupils Gained enrollment, gained FRPL pupils

SOURCE: Council Analysis of NYSED School Aid data used to calculate Foundation Aid in 2006-07 and 2016-17.

slide-7
SLIDE 7

3/20/2017 7

Student needs have been increasing… Student needs have been increasing… Student needs have been increasing… Student needs have been increasing…

13 Region % of total 2007 % of total 2014 % Change 2007 to 2014 Total State 19.6% 22.9% 11.4% Long Island 6.1% 9.9% 53.2% New York City 27.6% 29.9% 2.6% Lower Hudson Valley 10.2% 16.2% 58.3% Mid-Hudson Valley 14.3% 18.4% 19.1% Capital Region 13.6% 17.4% 22.1% Mohawk Valley 22.0% 26.8% 20.2% Central New York 18.1% 22.6% 21.2% North Country 19.9% 22.9% 16.1% Southern Tier 19.8% 23.6% 14.6% Finger Lakes 17.5% 20.7% 13.3% Western New York 19.7% 22.9% 10.4%

SOURCE: Indicator Report: Children and Youth Living Below Poverty Number and Percent Children/Youth Ages Birth-17 Years: NYS Kids' Well-being Indicators Clearinghouse (KWIC). NYS Council on Children and Families, Web. 29 Sept. 2016.

Percentage of children (ages 0-17) in poverty, 2007 vs. 2014, by region

slide-8
SLIDE 8

3/20/2017 8

The Governor’s Budget…

  • 3

ECB assumptions:

  • 2.75% increase in salaries
  • 6.7% increase for health

insurance

  • Reduction in TRS costs
  • 2.2% increase for non-

personnel costs

  • Minimal offset to total cost

increase from local revenue due to 1.26% tax cap allowable growth factor Conclusion: $1.5 billion state aid increase needed.

SOURCE: ECB estimates and Division of the Budget publications

Meeting Students’ Greatest Needs | Educational Conference Board | March 3, 2017

  • !
  • "

# $

  • "

# $

  • "

% &' ( %)' *

& & ++,

  • .+/.-

012

  • (-+,

)& ++, 16

slide-9
SLIDE 9

3/20/2017 9

Some other items from the Executive Budget Some other items from the Executive Budget Some other items from the Executive Budget Some other items from the Executive Budget

  • $35 million to expand after-school programs in high poverty communities
  • $5 million to expand pre-k for 3 and 4 year-olds in high need districts
  • $5 million to expand early college high schools
  • $2 million for AP fee waivers
  • $2 million to expand Master Teacher Program ($15,000 stipends)
  • $400,000 for Excellence in teaching Awards ($5,000 awards for professional

development)

  • $300,00 for cyber-bullying prevention
  • Flat funding for State Education Department operations
  • An Inspector General for SED.

17

School Aid changes School Aid changes School Aid changes School Aid changes

  • Foundation Aid – more on this to follow
  • Expense-based and categorical aids appearing on run (e.g.,

BOCES, Transportation, Building Aids, etc.) – current law formulas continued, except…

  • Prekindergarten: Priority Pre-K would be merged into Universal Pre-K –

beginning an effort to consolidate 7 programs

  • Charter school tuition would be unfrozen and a new charter school

transition aid would be added to partly offset the impact of the cost increase

  • An incentive would be created in the instructional materials aids for

districts to purchase online materials, allowing savings to be used for professional development

  • Again proposes freezing data in aid calculations – perennially rejected by

the Legislature

18

slide-10
SLIDE 10

3/20/2017 10

Foundation Aid Foundation Aid Foundation Aid Foundation Aid – – – – the essential difference the essential difference the essential difference the essential difference

  • Current Law:
  • 2016-17 base: $16.37 billion
  • Full phase-in total: $20.53 billion (estimated, without save-harmless)
  • Update data in full phase-in formula each year, decide how fast to proceed

toward full implementation by adjusting phase-in factors

  • Work backward from a target
  • Executive proposal:
  • 2016-17 base: $16.47 billion
  • Decide each year how much to increase Foundation Aid over the base and

how to allocate the increase ($428 million for 2017-18)

  • No fixed target or basis for anticipating possible future aid

19

Foundation Aid Foundation Aid Foundation Aid Foundation Aid – – – – Current Current Current Current

  • “Four moving pieces”:
  • [Per pupil amount based on cost of providing

general education in “successful schools”

  • times Pupil Needs Index
  • times Regional Cost Index
  • minus Expected Local Contribution, varies based on

property wealth and resident income

  • Amount of allowable increase toward full formula amount is

set by a phase-in factor – most recent increases have been distributed by adjusting the phase-in factor

  • State is currently over $4 billion behind in phasing in the

formula

20

times pupil count

slide-11
SLIDE 11

3/20/2017 11

Foundation Aid Foundation Aid Foundation Aid Foundation Aid – – – – Proposed Proposed Proposed Proposed

  • Budget would repeal 7 pages of law establishing current formula.
  • Districts would receive what they received in 2016-17 plus a

“base increase” plus (if eligible) a “community schools increase” (restricted in use).

  • Base and community schools increases would use factors similar

to current formula (more details in next slide).

  • Budget bill says that for 2018-19 and thereafter, each district’s

Foundation Aid shall be what it received in 2017-18.*

  • Districts would not have a basis for making assumptions about

next year’s Foundation Aid.

*Note: State Financial Plan projects a $996 million, 3.9% increase in total School Aid

for 2017-18 – that essentially assumes there would be some increase in Foundation Aid. 21

Foundation Aid Foundation Aid Foundation Aid Foundation Aid – – – – Proposed Proposed Proposed Proposed

  • “Base increase”
  • Every district receives an increase of not less than 1% nor more than

15%.

  • Formula uses factors from existing formula, with adjustments –e.g.,

removes the .650 Income Wealth Index floor.

  • Essentially a new formula to allocate $378 million
  • Increases for Big 5 would be prescribed (not based on formula

factors):

  • 2.93% for New York City
  • 2.165% for Buffalo, Rochester, Syracuse and Yonkers
  • Community Schools increase
  • $50 million targeted to 24 districts with struggling schools or

concentrations of ELL students Every targeted district receives at least $150,000

  • Intended to be more restricted than 2016-17 set-aside
  • 2016-17 set-aside continues

22

slide-12
SLIDE 12

3/20/2017 12

The The The The current current current current Foundation Aid formula does correlate Foundation Aid formula does correlate Foundation Aid formula does correlate Foundation Aid formula does correlate aid with need aid with need aid with need aid with need

23

R² = 0.8687 $0 $2,000 $4,000 $6,000 $8,000 $10,000 $12,000 $14,000 $16,000 $18,000 $20,000 0% 10% 20% 30% 40% 50% 60% 70% 80% 90% 100% CWR Percentile (1 = poorest)

Foundation per Pupil Districts sorted by Combined Wealth Ratio Percentile

SOURCE: Council analysis of NYSED School Aid data

But too many districts are “on save But too many districts are “on save But too many districts are “on save But too many districts are “on save-

  • harmless” on Foundation Aid

harmless” on Foundation Aid harmless” on Foundation Aid harmless” on Foundation Aid

(receiving more aid in 2016 (receiving more aid in 2016 (receiving more aid in 2016 (receiving more aid in 2016-

  • 17 than fully phased

17 than fully phased 17 than fully phased 17 than fully phased-

  • in formula would generate)

in formula would generate) in formula would generate) in formula would generate)

24 SOURCE: Council analysis of NYSED School Aid data

Total State 38% NYC 0% Big 4 0% High Need Small aCities & Suburbs 5% High Need Rural 40% Average Need 43% Low Need 35% By Need/Resource Capacity Category By Region Total State 38% Long Island 28% New York City 0% Lower Hudson Valley 22% Mid-Hudson Valley 28% Capital Region 44% Mohawk Valley 55% Central New York 36% North Country 63% Southern Tier 51% Finger Lakes 33% Western New York 27%

Enrollment losses explain many of the save-harmless districts. But student needs have been increasing. The current formula does not work for many districts. Percentage of districts on save-harmless…

slide-13
SLIDE 13

3/20/2017 13

Composition of the Governor’s proposed School Aid Composition of the Governor’s proposed School Aid Composition of the Governor’s proposed School Aid Composition of the Governor’s proposed School Aid increase increase increase increase

25

  • 0.5%

0.0% 0.5% 1.0% 1.5% 2.0% 2.5% 3.0% 3.5% 4.0% 4.5%

Districts sorted by Combined Wealth Ratio Decile

Foundation Aid Other Building Aid SOURCE: Council analysis of NYSED School Aid data

Charter School Proposed Impact Outside NYC Charter School Proposed Impact Outside NYC Charter School Proposed Impact Outside NYC Charter School Proposed Impact Outside NYC

  • Charter School Basic Tuition would be unfrozen
  • Tuition has been frozen at 10-11 levels and last 3 years districts have been

paying charters an escalating per pupil amount known as supplemental tuition that was fully reimbursable in the following year.

  • Exec. Proposal would reimburse school districts outside of NYC

90% of increased tuition costs between 17-18 SY and 10-11 SY on a one year lag.

  • Reimbursement would phase-down over three years from 90% to 60% to

30%, and then nothing thereafter. Tuition would change annually.

  • Calculation of total cost unclear, but state reimbursement will cut

into the 18-19 school aid increase because reimbursement is included within the personal income growth index thereby impacting every district.

26

slide-14
SLIDE 14

3/20/2017 14

Homeless Students Homeless Students Homeless Students Homeless Students

  • McKinney-Vento Act was amended alongside ESEA in December
  • 2015. Exec has proposed changes necessary to comply.
  • Homeless students have expanded rights relating to:
  • Transportation- during the entire school year during which the student

became homeless even if housing is found in a new district plus new rights if following year is the terminal grade in the school. Transportation generally funded by the state, but may be provided by the district.

  • School-New statute focused more on school building than just district and

students have more rights to remain at the school that they attended or had right to attend.

  • Best interest determination process would be established to determine

what school a homeless student should attend.

  • Enrollment-Immediate enrollment required even if missing normally

required documents

27

Recovery High Schools Recovery High Schools Recovery High Schools Recovery High Schools

  • The budget would authorize BOCES to establish two recovery high

schools, one downstate and one upstate.

  • Students with diagnosed substance abuse disorders and desire to

recover would be eligible.

  • Sending districts would be eligible for BOCES aid.
  • Target date for the school openings is the 18-19 SY

28

slide-15
SLIDE 15

3/20/2017 15

Division of Human Rights Division of Human Rights Division of Human Rights Division of Human Rights

  • The Division of Human Rights doesn’t have jurisdiction over

accusations of violations student civil rights in schools.

  • The Governor and the Assembly have long sought to rectify this.
  • DHR jurisdiction over school districts for these cases would

subject districts to greater risk of monetary damages that are not available under other statutes.

  • Students are protected under the Dignity of All Students Act,

ADA, IDEA and the federal Office of Civil Rights.

29

A Sustainability Agenda A Sustainability Agenda A Sustainability Agenda A Sustainability Agenda

  • 1. Foundation Aid
  • Even leaving aside arguments over what the state “owes” as a result
  • f the Campaign for Fiscal Equity litigation, achieving something

resembling Foundation Aid makes sense.

  • 2007 formula was an under-appreciated accomplishment
  • Generally directed greatest aid per pupil to the neediest districts
  • Promised all districts more predictability in aid going forward
  • Used factors that could be understood and debated, making funding

decisions more transparent and decision-makers more accountable

  • The formula does need some updating –10 years have passed, too

many districts are on save-harmless

  • An predictable operating aid formula is a cornerstone in a

finance system that support multi-year planning – schools in

  • ther states have this and ours once did.

30

slide-16
SLIDE 16

3/20/2017 16

A Sustainability Agenda A Sustainability Agenda A Sustainability Agenda A Sustainability Agenda

  • 2. Tax Cap – amend it to support multi-year planning
  • 2%, not lesser of 2% or inflation
  • Enact BOCES capital and PILOT changes
  • No negative caps
  • Allow districts seeking an over-ride to submit 2 proposals – one

within cap, one to over-ride, simple majority required to approve either.

31

A Sustainability Agenda A Sustainability Agenda A Sustainability Agenda A Sustainability Agenda

  • 3. Mandate Relief/“Maximizing Resources”
  • Why is New York #1 in education spending?
  • Big ticket items (e.g., Triborough are not on the table)
  • What are smaller scale items that could help now?
  • What are actions that might “set the table” for future change?

With both the tax cap and mandates: If you’re not going to change the rules, you must fund the rules!

32

slide-17
SLIDE 17

3/20/2017 17

A Sustainability Agenda A Sustainability Agenda A Sustainability Agenda A Sustainability Agenda

  • 4. Reserves – give schools tools like those available to

municipalities

  • The Comptroller is doing his job – auditing according to standards

prescribed by law and accounting authorities

  • Who says all the laws make sense?

₋ U.S. Government Finance Officers Association recommends a 10% unrestricted fund balance for school districts ₋ New York State municipalities have no percentage limit on unrestricted fund balance ₋ Municipalities can set aside funds for all their pension system obligations; schools cannot do so for their TRS obligations ₋ Schools have more accountability and disclosure requirements – and more were added in 2016

  • Priority for 2017: A TRS reserve
  • Anecdotally, we hear that the tax cap has changed how district

leaders think about reserves.

33

Budget Process Budget Process Budget Process Budget Process

  • Executive Budget was released in January.
  • On February 28th, the Assembly and Senate released

their revenue estimates for the 17-18 fiscal year

  • Assembly=$1.38 billion more than the Exec. Budget.
  • Senate=$503 million more than the Exec. Budget.
  • Consensus Revenue Forecast=$200 million above Exec.
  • Tax increases, or cuts to other budgetary areas would have to
  • ccur for School Aid to increase significantly.
  • One house budget resolutions are scheduled to be

voted upon on March 13, but they may be publicly released earlier.

34

slide-18
SLIDE 18

3/20/2017 18

Budget Process Budget Process Budget Process Budget Process

  • Shortly after the budget resolutions are approved, joint

conference committees will begin.

  • Representatives from both houses will hold public meetings

where they lay out their priorities for the relevant issue areas.

  • These meetings are generally pro forma
  • The only actual relevant information that may come from

them are “table targets”

  • Table targets identify the total dollars available for each issue

area to spend on aid an other various proposals.

  • Once table targets are identified, we will have a decent idea
  • f how the final budget agreement will shake out.

35

Budget Process Budget Process Budget Process Budget Process

  • Negotiation Table (Insider’s Perspective)
  • Three (four/IDC) men in a room concept applies to the leaders

meetings (Governor, Speaker, & Majority Leader), but also to the staff level.

  • Each leader, including IDC leader, Jeff Klein, will have

representatives at a negotiating table for every budget issue.

  • The Education negotiations take place in a very uncomfortable,

small room.

  • Issues that can’t be negotiated at the staff level are then “kicked

up” to the Secretaries table (top staff for each leader) and then to the Governor, Majority Leader, and Speaker if the Secretaries fail to reach accord.

36

slide-19
SLIDE 19

3/20/2017 19

Lobby Day Lobby Day Lobby Day Lobby Day

  • What should you be trying to accomplish?
  • Influence the One-House Budget Proposals
  • Support The Council’s recommendations relating to school aid

and policy recommendations.

  • Share positive developments
  • Often Legislators only here the negatives for constituents and

that is what is driving the individual to visit the legislator in the first place.

  • Legislators like good news as well.
  • Explain your district’s unique circumstances and why

you need X dollars to help students

37

Lobby Day Lobby Day Lobby Day Lobby Day

  • Influence Effectively:
  • Your problems are THEIR problems.
  • If students lack access to academic programing or

extracurricular activities, you get blamed, but so do they.

  • Their job is just as precarious as your, and oftentimes more

since their “contracts” are two years.

  • Most elected officials only have to survive a primary to be

guaranteed a general election victory. VERY few people vote.

  • Legislators don’t want to disappoint you because you have a

pedestal!

  • Remember to share good news, not just the concerns.

38

slide-20
SLIDE 20

3/20/2017 20

Relationship Building Relationship Building Relationship Building Relationship Building

  • Lobbying and Advocacy may not have been a job

requirement on the brochure, but it is in reality.

  • The stronger advocate you are at home, the more effective

The Council will be in Albany.

  • Use every opportunity to establish a relationship and

nurture it.

  • Invite legislators to school events, even just for a photo op.
  • Call the legislator to thank them for their support.
  • Time to make a friend, is not when you need one

39

www.nyscoss.org Follow us on Twitter: https://twitter.com/NYSchoolSupts

40