Proposed Reductions in Flooding Depths for $77 Million Storm Water - - PowerPoint PPT Presentation

proposed reductions in flooding depths for 77 million
SMART_READER_LITE
LIVE PREVIEW

Proposed Reductions in Flooding Depths for $77 Million Storm Water - - PowerPoint PPT Presentation

Proposed Reductions in Flooding Depths for $77 Million Storm Water Improvement Project 10-Year Rain Event Existing Conditions Water Surface Elevation Proposed Condition Water Surface Elevations and Existing Lowest (WSEL) Reductions Alternative


slide-1
SLIDE 1

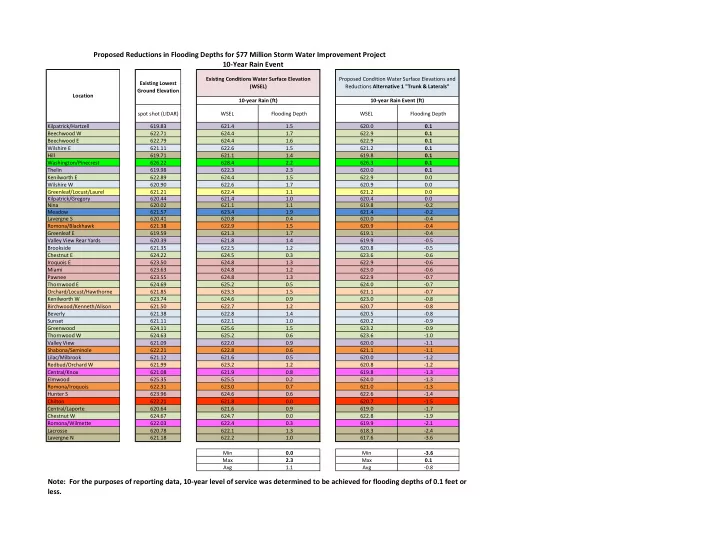
spot shot (LIDAR) WSEL Flooding Depth WSEL Flooding Depth Kilpatrick/Hartzell 619.83 621.4 1.5 620.0 0.1 Beechwood W 622.71 624.4 1.7 622.9 0.1 Beechwood E 622.79 624.4 1.6 622.9 0.1 Wilshire E 621.11 622.6 1.5 621.2 0.1 Hill 619.71 621.1 1.4 619.8 0.1 Washington/Pinecrest 626.22 628.4 2.2 626.3 0.1 Thelin 619.98 622.3 2.3 620.0 0.1 Kenilworth E 622.89 624.4 1.5 622.9 0.0 Wilshire W 620.90 622.6 1.7 620.9 0.0 Greenleaf/Locust/Laurel 621.21 622.4 1.1 621.2 0.0 Kilpatrick/Gregory 620.44 621.4 1.0 620.4 0.0 Nina 620.02 621.1 1.1 619.8

  • 0.2

Meadow 621.57 623.4 1.9 621.4

  • 0.2

Lavergne S 620.41 620.8 0.4 620.0

  • 0.4

Romona/Blackhawk 621.38 622.9 1.5 620.9

  • 0.4

Greenleaf E 619.59 621.3 1.7 619.1

  • 0.4

Valley View Rear Yards 620.39 621.8 1.4 619.9

  • 0.5

Brookside 621.35 622.5 1.2 620.8

  • 0.5

Chestnut E 624.22 624.5 0.3 623.6

  • 0.6

Iroquois E 623.50 624.8 1.3 622.9

  • 0.6

Miami 623.63 624.8 1.2 623.0

  • 0.6

Pawnee 623.55 624.8 1.3 622.9

  • 0.7

Thornwood E 624.69 625.2 0.5 624.0

  • 0.7

Orchard/Locust/Hawthorne 621.85 623.3 1.5 621.1

  • 0.7

Kenilworth W 623.74 624.6 0.9 623.0

  • 0.8

Birchwood/Kenneth/Alison 621.50 622.7 1.2 620.7

  • 0.8

Beverly 621.38 622.8 1.4 620.5

  • 0.8

Sunset 621.11 622.1 1.0 620.2

  • 0.9

Greenwood 624.11 625.6 1.5 623.2

  • 0.9

Thornwood W 624.63 625.2 0.6 623.6

  • 1.0

Valley View 621.09 622.0 0.9 620.0

  • 1.1

Shabona/Seminole 622.21 622.8 0.6 621.1

  • 1.1

Lilac/Milbrook 621.12 621.6 0.5 620.0

  • 1.2

Redbud/Orchard W 621.99 623.2 1.2 620.8

  • 1.2

Central/Knox 621.08 621.9 0.8 619.8

  • 1.3

Elmwood 625.35 625.5 0.2 624.0

  • 1.3

Romona/Iroquois 622.31 623.0 0.7 621.0

  • 1.3

Hunter S 623.96 624.6 0.6 622.6

  • 1.4

Chilton 622.21 621.8 0.0 620.7

  • 1.5

Central/Laporte 620.64 621.6 0.9 619.0

  • 1.7

Chestnut W 624.67 624.7 0.0 622.8

  • 1.9

Romona/Wilmette 622.03 622.4 0.3 619.9

  • 2.1

Lacrosse 620.78 622.1 1.3 618.3

  • 2.4

Lavergne N 621.18 622.2 1.0 617.6

  • 3.6

Min 0.0 Min

  • 3.6

Max 2.3 Max 0.1 Avg 1.1 Avg

  • 0.8

Note: For the purposes of reporting data, 10-year level of service was determined to be achieved for flooding depths of 0.1 feet or less. 10-Year Rain Event Proposed Reductions in Flooding Depths for $77 Million Storm Water Improvement Project

Location Existing Lowest Ground Elevation Existing Conditions Water Surface Elevation (WSEL) 10-year Rain (ft) 10-year Rain Event (ft) Proposed Condition Water Surface Elevations and Reductions Alternative 1 "Trunk & Laterals"

slide-2
SLIDE 2

spot shot (LIDAR) WSEL Flooding Depth WSEL Flooding Depth Washington/Pinecrest 626.22 628.8 2.6 627.9 1.7 Beechwood W 622.71 624.9 2.2 624.4 1.7 Beechwood E 622.79 624.9 2.2 624.4 1.6 Wilshire W 620.90 622.9 2.0 622.5 1.6 Thelin 619.98 622.7 2.7 621.5 1.6 Kenilworth E 622.89 624.9 2.1 624.4 1.5 Wilshire E 621.11 622.9 1.8 622.6 1.4 Romona/Blackhawk 621.38 623.4 2.0 622.8 1.4 Kilpatrick/Hartzell 619.83 621.7 1.8 621.2 1.4 Meadow 621.57 623.7 2.1 622.9 1.3 Hill 619.71 621.4 1.7 620.9 1.2 Greenleaf/Locust/Laurel 621.21 622.7 1.5 622.4 1.1 Kilpatrick/Gregory 620.44 621.8 1.3 621.6 1.1 Greenleaf E 619.59 621.7 2.1 620.6 1.1 Nina 620.02 621.5 1.4 621.1 1.0 Brookside 621.35 622.9 1.6 622.3 1.0 Iroquois E 623.50 625.3 1.8 624.5 1.0 Orchard/Locust/Hawthorne 621.85 623.6 1.8 622.8 1.0 Miami 623.63 625.3 1.7 624.6 1.0 Pawnee 623.55 625.3 1.8 624.5 0.9 Valley View Rear Yards 620.39 622.1 1.7 621.3 0.9 Birchwood/Kenneth/Alison 621.50 623.0 1.5 622.4 0.9 Greenwood 624.11 626.0 1.9 625.0 0.8 Beverly 621.38 622.9 1.6 622.1 0.8 Shabona/Seminole 622.21 623.4 1.2 623.0 0.7 Kenilworth W 623.74 625.0 1.2 624.4 0.7 Chilton 622.21 622.9 0.7 622.9 0.7 Sunset 621.11 622.4 1.3 621.8 0.7 Lavergne S 620.41 621.3 0.9 621.0 0.6 Romona/Iroquois 622.31 623.4 1.1 622.9 0.5 Thornwood W 624.63 625.4 0.7 625.1 0.5 Redbud/Orchard W 621.99 623.5 1.5 622.5 0.5 Thornwood E 624.69 625.2 0.5 625.2 0.5 Valley View 621.09 622.3 1.2 621.5 0.4 Central/Knox 621.08 622.2 1.1 621.4 0.4 Elmwood 625.35 625.9 0.5 625.7 0.3 Chestnut E 624.22 624.9 0.7 624.5 0.3 Lilac/Milbrook 621.12 621.8 0.7 621.4 0.2 Hunter S 623.96 625.2 1.2 624.2 0.2 Central/Laporte 620.64 621.9 1.3 620.7 0.1 Chestnut W 624.67 625.3 0.6 624.7 0.0 Lacrosse 620.78 622.4 1.6 620.7 0.0 Romona/Wilmette 622.03 622.7 0.7 621.4

  • 0.6

Lavergne N 621.18 622.4 1.3 618.9

  • 2.2

Min 0.5 Min

  • 2.2

Max 2.7 Max 1.7 Avg 1.5 Avg 0.8

25-Year Rain Event Proposed Reductions in Flooding Depths for $77 Million Storm Water Improvement Project

Location Lowest Ground Elevation Proposed Condition Water Surface Elevations and Reductions Alternative 1 "Trunk & Laterals" 25-year (ft) 25-year (ft) Existing Conditions Water Surface Elevation (WSEL)

slide-3
SLIDE 3
slide-4
SLIDE 4

spot shot (LIDAR) WSEL Flooding Depth WSEL Flooding Depth Washington/Pinecrest 626.22 629.2 2.9 628.4 2.2 Beechwood W 622.71 625.3 2.6 624.9 2.2 Thelin 619.98 623.0 3.0 622.1 2.1 Beechwood E 622.79 625.3 2.5 624.9 2.1 Romona/Blackhawk 621.38 623.7 2.3 623.4 2.0 Kenilworth E 622.89 625.3 2.4 624.9 2.0 Wilshire W 620.90 623.1 2.2 622.9 2.0 Kilpatrick/Hartzell 619.83 621.9 2.1 621.6 1.8 Wilshire E 621.11 623.1 2.0 622.9 1.8 Meadow 621.57 623.9 2.3 623.3 1.7 Hill 619.71 621.6 1.9 621.3 1.6 Miami 623.63 625.7 2.1 625.2 1.5 Greenleaf E 619.59 622.0 2.4 621.1 1.5 Greenleaf/Locust/Laurel 621.21 622.9 1.7 622.7 1.5 Kilpatrick/Gregory 620.44 622.0 1.6 621.9 1.4 Orchard/Locust/Hawthorne 621.85 623.7 1.9 623.3 1.4 Iroquois E 623.50 625.7 2.2 624.9 1.4 Nina 620.02 621.7 1.6 621.4 1.4 Pawnee 623.55 625.7 2.2 624.9 1.4 Brookside 621.35 623.2 1.8 622.7 1.4 Greenwood 624.11 626.2 2.1 625.5 1.3 Valley View Rear Yards 620.39 622.4 2.0 621.7 1.3 Shabona/Seminole 622.21 623.7 1.5 623.4 1.2 Kenilworth W 623.74 625.3 1.6 624.9 1.2 Birchwood/Kenneth/Alison 621.50 623.2 1.7 622.6 1.1 Beverly 621.38 623.0 1.7 622.5 1.1 Romona/Iroquois 622.31 623.7 1.4 623.4 1.1 Sunset 621.11 622.6 1.5 622.2 1.1 Lavergne S 620.41 621.6 1.2 621.4 1.0 Redbud/Orchard W 621.99 623.7 1.7 623.0 1.0 Chilton 622.21 623.1 0.9 623.1 0.9 Valley View 621.09 622.4 1.3 622.0 0.9 Central/Knox 621.08 622.4 1.3 621.9 0.8 Lacrosse 620.78 622.7 1.9 621.5 0.7 Hunter S 623.96 625.7 1.7 624.7 0.7 Thornwood W 624.63 625.7 1.0 625.3 0.7 Chestnut E 624.22 625.3 1.1 624.9 0.7 Central/Laporte 620.64 622.1 1.5 621.3 0.6 Lilac/Milbrook 621.12 622.1 1.0 621.7 0.6 Thornwood E 624.69 625.3 0.6 625.2 0.5 Elmwood 625.35 625.9 0.5 625.9 0.5 Chestnut W 624.67 625.6 1.0 624.9 0.3 Romona/Wilmette 622.03 622.9 0.9 621.9

  • 0.1

Lavergne N 621.18 622.6 1.4 619.5

  • 1.7

Min 0.5 Min

  • 1.7

Max 3.0 Max 2.2 Avg 1.7 Avg 1.2

50-Year Rain Event Proposed Reductions in Flooding Depths for $77 Million Storm Water Improvement Project

Location Lowest Ground Elevation Proposed Condition Water Surface Elevations and Reductions Alternative 1 "Trunk & Laterals" 50-year (ft) 50-year (ft) Existing Conditions Water Surface Elevation (WSEL)

slide-5
SLIDE 5

spot shot (LIDAR) WSEL Flooding Depth WSEL Flooding Depth Washington/Pinecrest 626.22 629.5 3.3 628.8 2.6 Beechwood W 622.71 625.7 3.0 625.3 2.6 Beechwood E 622.79 625.7 2.9 625.3 2.5 Thelin 619.98 623.2 3.3 622.5 2.5 Romona/Blackhawk 621.38 623.9 2.6 623.8 2.4 Kenilworth E 622.89 625.7 2.8 625.3 2.4 Wilshire W 620.90 623.3 2.4 623.2 2.3 Kilpatrick/Hartzell 619.83 622.2 2.4 622.0 2.2 Wilshire E 621.11 623.3 2.2 623.2 2.1 Meadow 621.57 624.1 2.6 623.6 2.0 Greenleaf E 619.59 622.3 2.7 621.6 2.0 Miami 623.63 626.0 2.4 625.5 1.9 Iroquois E 623.50 626.0 2.5 625.4 1.9 Hill 619.71 621.8 2.0 621.6 1.8 Pawnee 623.55 626.0 2.4 625.4 1.8 Greenwood 624.11 626.4 2.3 625.9 1.8 Orchard/Locust/Hawthorne 621.85 623.8 2.0 623.6 1.8 Greenleaf/Locust/Laurel 621.21 623.1 1.9 623.0 1.8 Valley View Rear Yards 620.39 622.5 2.1 622.1 1.7 Kilpatrick/Gregory 620.44 622.3 1.8 622.2 1.7 Brookside 621.35 623.4 2.1 623.1 1.7 Nina 620.02 621.9 1.8 621.7 1.7 Shabona/Seminole 622.21 623.9 1.7 623.8 1.6 Kenilworth W 623.74 625.7 2.0 625.3 1.5 Romona/Iroquois 622.31 623.9 1.6 623.8 1.5 Beverly 621.38 623.2 1.8 622.8 1.5 Sunset 621.11 622.9 1.8 622.6 1.4 Birchwood/Kenneth/Alison 621.50 623.3 1.8 622.9 1.4 Redbud/Orchard W 621.99 623.8 1.8 623.4 1.4 Lavergne S 620.41 621.8 1.4 621.7 1.3 Lacrosse 620.78 622.8 2.0 622.0 1.2 Valley View 621.09 622.5 1.4 622.3 1.2 Hunter S 623.96 626.0 2.0 625.1 1.2 Central/Knox 621.08 622.6 1.5 622.2 1.1 Central/Laporte 620.64 622.5 1.8 621.7 1.1 Chestnut E 624.22 625.7 1.5 625.3 1.1 Chilton 622.21 623.3 1.0 623.2 1.0 Lilac/Milbrook 621.12 622.3 1.2 622.1 0.9 Thornwood W 624.63 625.8 1.2 625.4 0.8 Chestnut W 624.67 625.8 1.2 625.3 0.6 Thornwood E 624.69 625.7 1.0 625.3 0.6 Elmwood 625.35 626.0 0.6 625.9 0.6 Romona/Wilmette 622.03 623.1 1.0 622.3 0.3 Lavergne N 621.18 622.7 1.6 620.1

  • 1.0

Min 0.6 Min

  • 1.0

Max 3.3 Max 2.6 Avg 2.0 Avg 1.5

100-Year Rain Event Proposed Reductions in Flooding Depths for $77 Million Storm Water Improvement Project

Location Lowest Ground Elevation Existing Conditions Water Surface Elevation (WSEL) 100-year (ft) 100-year (ft) Proposed Condition Water Surface Elevations and Reductions Alternative 1 "Trunk & Laterals"

slide-6
SLIDE 6