
SLIDE 1
4/27/2017 1
Probability
IMGD 2905
Chapters 4 & 5
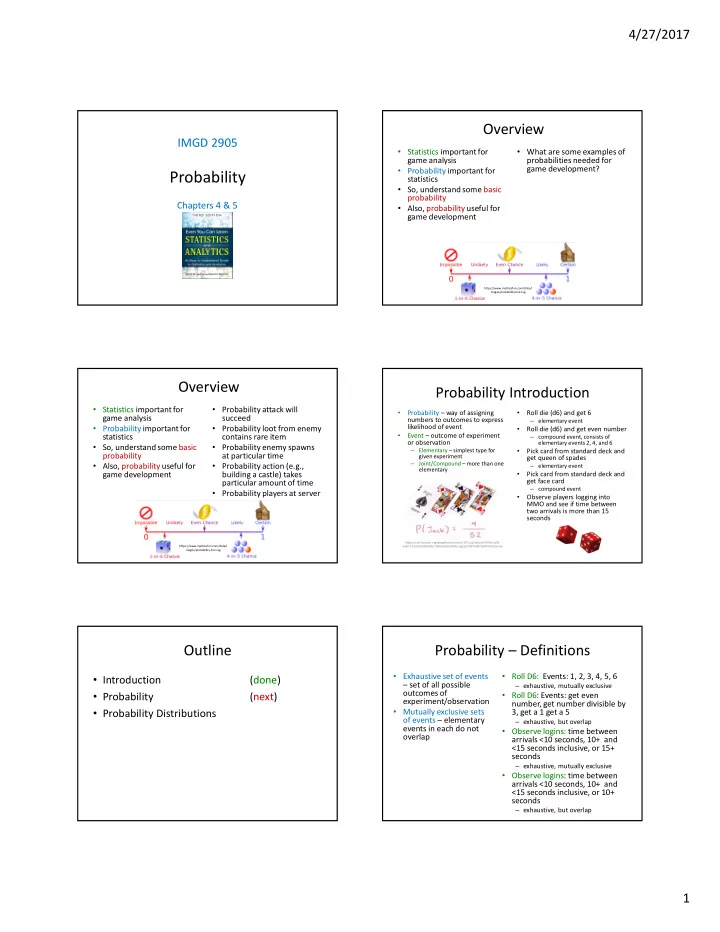
Overview
- Statistics important for
game analysis
- Probability important for
statistics
- So, understand some basic
probability
- Also, probability useful for
game development
- What are some examples of
probabilities needed for game development?
https://www.mathsisfun.com/data/i mages/probability-line.svg
Overview
- Statistics important for
game analysis
- Probability important for
statistics
- So, understand some basic
probability
- Also, probability useful for
game development
- Probability attack will
succeed
- Probability loot from enemy
contains rare item
- Probability enemy spawns
at particular time
- Probability action (e.g.,
building a castle) takes particular amount of time
- Probability players at server
https://www.mathsisfun.com/data/i mages/probability-line.svg
Probability Introduction
- Probability – way of assigning
numbers to outcomes to express likelihood of event
- Event – outcome of experiment
- r observation
– Elementary – simplest type for given experiment – Joint/Compound – more than one elementary
- Roll die (d6) and get 6
– elementary event
- Roll die (d6) and get even number
– compound event, consists of elementary events 2, 4, and 6
- Pick card from standard deck and
get queen of spades
– elementary event
- Pick card from standard deck and
get face card
– compound event
- Observe players logging into
MMO and see if time between two arrivals is more than 15 seconds
https://cdn.kastatic.org/googleusercontent/Z0TuLq2KolavsrfDXSbLqi0S- wnlCrC13cKGG68wK9ljrTiXzRqvfq7IpWNzcwgzlpEOI8YmMafp4K4zO0sanvXu
Outline
- Introduction
(done)
- Probability
(next)
- Probability Distributions
Probability – Definitions
- Exhaustive set of events
– set of all possible
- utcomes of
experiment/observation
- Mutually exclusive sets
- f events – elementary
events in each do not
- verlap
- Roll D6: Events: 1, 2, 3, 4, 5, 6
– exhaustive, mutually exclusive
- Roll D6: Events: get even
number, get number divisible by 3, get a 1 get a 5
– exhaustive, but overlap
- Observe logins: time between
arrivals <10 seconds, 10+ and <15 seconds inclusive, or 15+ seconds
– exhaustive, mutually exclusive
- Observe logins: time between
arrivals <10 seconds, 10+ and <15 seconds inclusive, or 10+ seconds
– exhaustive, but overlap