
Probability: Classical and Bayesian 12/14/1998 1998-Schield-UNI-Slides.pdf 1
P(h|e) P(e|h) P(e|~h)
12/14/98 Page 1Colloquium University of Northern Iowa
December 14, 1998
MILO SCHIELD
Augsburg College
www.augsburg.edu/ppages/schield schield@augsburg.edu
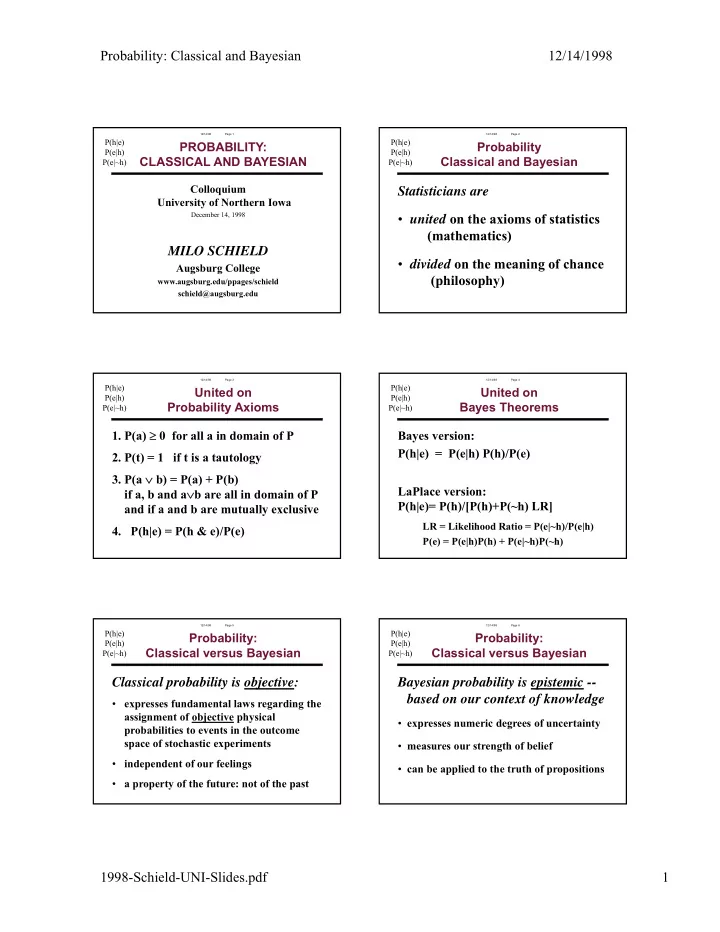
PROBABILITY: CLASSICAL AND BAYESIAN
P(h|e) P(e|h) P(e|~h)
12/14/98 Page 2Statisticians are
- united on the axioms of statistics
(mathematics)
- divided on the meaning of chance
(philosophy)
Probability Classical and Bayesian
P(h|e) P(e|h) P(e|~h)
12/14/98 Page 3United on Probability Axioms
- 1. P(a) ≥ 0 for all a in domain of P
- 2. P(t) = 1 if t is a tautology
- 3. P(a ∨ b) = P(a) + P(b)
if a, b and a∨b are all in domain of P and if a and b are mutually exclusive
- 4. P(h|e) = P(h & e)/P(e)
P(h|e) P(e|h) P(e|~h)
12/14/98 Page 4United on Bayes Theorems Bayes version: P(h|e) = P(e|h) P(h)/P(e) LaPlace version: P(h|e)= P(h)/[P(h)+P(~h) LR]
LR = Likelihood Ratio = P(e|~h)/P(e|h) P(e) = P(e|h)P(h) + P(e|~h)P(~h)
P(h|e) P(e|h) P(e|~h)
12/14/98 Page 5Probability: Classical versus Bayesian
Classical probability is objective:
- expresses fundamental laws regarding the
assignment of objective physical probabilities to events in the outcome space of stochastic experiments
- independent of our feelings
- a property of the future: not of the past
P(h|e) P(e|h) P(e|~h)
12/14/98 Page 6Probability: Classical versus Bayesian
Bayesian probability is epistemic -- based on our context of knowledge
- expresses numeric degrees of uncertainty
- measures our strength of belief
- can be applied to the truth of propositions