
SLIDE 1
!
Probability*and*Statistics* for*Computer*Science**
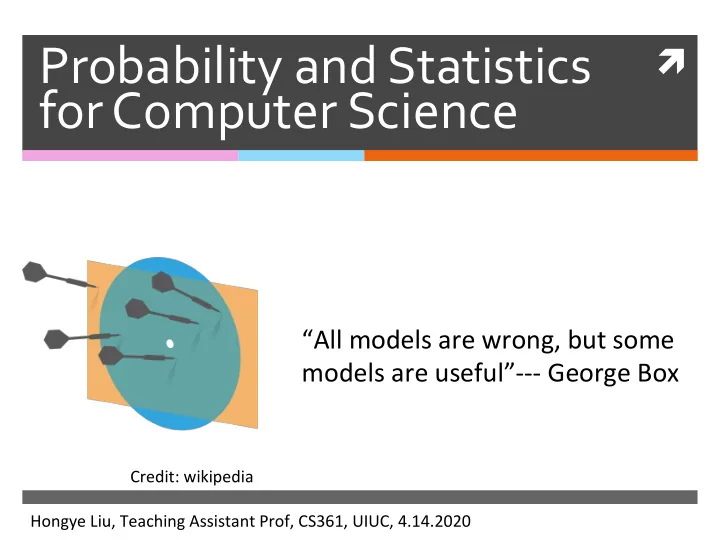
“All!models!are!wrong,!but!some! models!are!useful”555!George!Box!
Hongye!Liu,!Teaching!Assistant!Prof,!CS361,!UIUC,!4.14.2020! Credit:!wikipedia!
Probability*and*Statistics* ! for*Computer*Science** - - PowerPoint PPT Presentation
Probability*and*Statistics* ! for*Computer*Science** All!models!are!wrong,!but!some! models!are!useful555!George!Box! Credit:!wikipedia! Hongye!Liu,!Teaching!Assistant!Prof,!CS361,!UIUC,!4.14.2020! Last*time*
!
Probability*and*Statistics* for*Computer*Science**
“All!models!are!wrong,!but!some! models!are!useful”555!George!Box!
Hongye!Liu,!Teaching!Assistant!Prof,!CS361,!UIUC,!4.14.2020! Credit:!wikipedia!
Last*time*
StochasOc!Gradient!Descent! Naïve!Bayesian!Classifier!
An*example*of*Naive*Bayes*training*
Training!data!
X(1)% X(2)% y% 3.5! 10! 1! 1.0! 8! 1! 0.0! 10! 51! 53.0! 14! 51!
Modeling!!!!!!!!!!!!!!! as!normal!
P(x(1)|y)
P(x(1)|y = 1)
µMLE = 3.5 + 1.0 2 = 2.25
σMLE = 1.25
P(x(1)|y = −1)
µMLE = −1.5 σMLE = 1.5
Modeling!!!!!!!!!!!!!!! as!Poisson!
P(x(2)|y)
P(x(2)|y = 1)
λMLE = 10 + 8 2 = 9
P(x(2)|y = −1)
λMLE = 12
Modeling!!!!!!!!!!!!!!! as!Bernoulli!
P(y)
P(y = 1) = 2 4 = 0.5
P(y = −1) = 0.5
laser
V
discrete
&a
3. 9
?
pay 1*7 PIXIYIPCYI
T
Classification*example:*
argmax
y
logP(x(j)|y) + log P(y)
the!example!
!!!!!!!!!!!!!!!!!!!!!!!!! ! ! ! ! !
Classification*example:*
argmax
y
logP(x(j)|y) + log P(y)
the!example!
g(y) =
y = −1
!!!!!!!!!!!!!!!!!!!!!!!!! ! ! ! ! !
Example*of*Naïve*Bayesian*Model*
“Bag!of!words”!Naive!Bayesian!models!for! document!class!
!!!!!!!!!!!!!!!! !!!!!!!!!!!!!!! !!!!!!!!!!!!!!! X5windows! MS5windows! document!(represented!as!a! bag5of5words!bit!vector),! each!column!is!a!word!
g-
'subject
" -I
What*about*the*decision*boundary?*
Not!explicit!as!in!the!case!of!decision!tree! This!method!is!parametric,!generaOve!
The!model!was!specified!with!parameters!to!
generate!label!for!test!data!
Pros*and*Cons*of*Naïve*Bayesian*Classifier*
Pros:!
Simple!approach! Good!accuracy! Good!for!high!dimensional!data!
Cons:!
The!assumpOon!of!condiOonal!independence!of!
features!
No!explicit!decision!boundary! SomeOmes!has!numerical!issues!
Content*
Naïve!Bayesian!Classifier!(cont)! Linear!regression!
The%problem% The!least!square!soluOon! The!training!and!predicOon! The!R5squared!for!the!
evaluaOon!of!the!fit.!
Some*popular*topics*in*Ngram*
Regression*models*are*Machine*learning* methods*
Regression!models!have!been!
around!for!a!while!
Dr.!Kelvin!Murphy’s!Machine!
Learning!book!has!3+!chapters!on! regression!
Content*
Linear!regression!
The%problem% The!least!square!soluOon! The!training!and!predicOon! The!R5squared!for!the!
evaluaOon!of!the!fit.! !
Wait,*have*we*seen*the*linear*regression* before?*
.
= @I
'
com
=T
It’s*about*Relationship*between* data*features*
Example:!does!the!Height!of!people!relate!to!
people’s!weight?!!
x!:!!HIGHT,!!y:!WEIGHT!
Chicago*social*economic*census*
The!census!included!77!communiOes!in!Chicago! The!census!evaluated!the!average!hardship!index!of!the!residents! The!census!evaluated!the!following!parameters!for!each!
community:!
!
Given&a&new&community&and&its¶meters,&& can&you&predict&its&average&hardship&index&with&all&these¶meters?&
Chicago*social*economic*census*
The!scaler!plots!and!
the!k5means!clusters!
Take!a!log!of!the!
income!for!it!shows! beler!trend!
!
The*regression*problem*
Given!a!set!of!feature!vectors!xi!where!!each!has!a!
numerical!label!yi,!we!want!to!train!a!model!that!can! map!unlabeled!vectors!to!numerical!values!
We!can!think!of!regression!as!fimng!a!line!(or!curve!
Regression!is!like!classificaOon!except!that!the!
predicOon!target!is!a!number,!not!a!class!label.! (PredicOng!class!label!can!be!considered!a!special! case!of!regression)!0
feel
valued
Some*terminology*
Suppose!the!dataset!!!!!!!!!!!!!consists!of!N!labeled!
items!
If!we!represent!the!dataset!as!a!table!
The!d!columns!represenOng!!!!!!!!are!called!
explanatory%variables%
The!numerical!column!y!
1! 3! 0! 2! 3! 2! 3! 6! 5!
y
x(1) x(2)
{(x, y)} (xi, yi)
x(j)
{x} is!called!the!dependent% variable%%
a
Variables*of*the*Chicago*census*
[1]!"PERCENT_OF_HOUSING_CROWDED"!!!!!!!!!!!!!!!!!!!! [2]"PERCENT_HOUSEHOLDS_BELOW_POVERTY"!!!!!!!!!!!!! [3]!"PERCENT_AGED_16p_UNEMPLOYED"!!!!!!!!!!!!!!!!!!! [4]"PERCENT_AGED_25p_WITHOUT_HIGH_SCHOOL_DI PLOMA"! [5]!"PERCENT_AGED_UNDER_18_OR_OVER_64"!!!!!!!!!!!!!! [6]"PER_CAPITA_INCOME"!!!!!!!!!!!!!!!!!!!!!!!!!!!! [7]!"HardshipIndex"!!
Which*is*the*dependent*variable*in*the* census*example?*
A.!"PERCENT_OF_HOUSING_CROWDED"!!! B.!"PERCENT_AGED_25p_WITHOUT_HIGH_SCHOOL_DIPLOMA”! C.!"HardshipIndex”!! D.!"PERCENT_AGED_UNDER_18_OR_OVER_64"!!!!!!!!!!!!!!
Linear*model*
We!begin!by!modeling!y!as!a!linear!funcOon!of!!!!!!!!!!!!!!
plus!randomness!
!In!vector!notaOon:!
1! 3! 0! 2! 3! 2! 3! 6! 5!
y
x(1) x(2)
x(j)
y = x(1)β1 + x(2)β2 + ... + x(d)βd + ξ
Where!!!!is!a!zero5mean!random!variable!that! represents!model!error!!
ξ
y = xTβ + ξ
Where!!!!!is!the!d5dimensional! vector!of!coefficients!that!we!train!
β
Each*data*item*gives*an*equation*
1! 3! 0! 2! 3! 2! 3! 6! 5!
y
x(1) x(2)
y = xTβ + ξ = x(1)β1 + x(2)β2 + ξ
The!model:!!
Training!data!
It fit 3949 ,
2
= 2+4.439452
5=3×1 , -16pct 'S ,
Which*together*form*a*matrix*equation*
1! 3! 0! 2! 3! 2! 3! 6! 5!
y
x(1) x(2)
y = xTβ + ξ = x(1)β1 + x(2)β2 + ξ
The!model!!
Training!data!
2 5 = 1 3 2 3 3 6 β1 β2
ξ1 ξ2 ξ3
Which*together*form*a*matrix*equation*
1! 3! 0! 2! 3! 2! 3! 6! 5!
y
x(1) x(2)
y = xTβ + ξ = x(1)β1 + x(2)β2 + ξ
The!model!!
Training!data!
2 5 = 1 3 2 3 3 6 β1 β2
ξ1 ξ2 ξ3
y = X · β + e
x
" '
x'4
µ
'
'?
Ex ,
a-
Q.*What’s*the*dimension*of*matrix*X?*
Training*the*model*is*to*choose*β*
Given!a!training!dataset!!!!!!!!!!!!!,!we!want!to!fit!a!
model!!
Define!!!!!!!!!!!!!!!!!!!!and!!!!!!!!!!!!!!!!!!!!and!! To!train!the!model,!we!need!to!choose!!!!!!that!makes!!!!!
small!in!the!matrix!equaOon!!!!
{(x, y)}
y = xTβ + ξ y = y1 . . . yN
X = xT
1
. . . xT
N
e = ξ1 . . . ξN β
e
y = X · β + e
Training*using*least*squares*
In!the!least!squares!method,!we!aim!to!minimize!! DifferenOaOng!with!respect!to!!!!!and!semng!to!zero!! If!!!!!!!!!!!!!is!inverOble,!the!least!squares!esOmate!of!
the!coefficient!is:!!
β e2 e2 = y − Xβ2 = (y − Xβ)T(y − Xβ)
XTXβ − XTy = 0
XTX
,.IT
Xp = y
' XTY
aiazAa =
( A+ AttaAismatr.is#⇒ zqptxtxp>
2lbIaaL=b
⇒ HpM=×Tyzp-
= 2 Xp sinceHbI=2'bIaa=aig
' = , ⇒ dPItp=xTy Note Hell " is scalar , all items in Cl) are scalar 211ell '✓
I' x
Convex*set*and*convex*function*
If!a!set!is!convex,!
any!line!connecOng! two!points!in!the! set!is!completely! included!in!the!set!!
A!convex!funcOon:!
the!area!above!the! curve!is!convex!!
The!least!square!
funcOon!is!convex%
Credit:!Dr.!Kelvin!Murphy!
f(λx + (1 − λ)y) < λf(x) + (1 − λ)f(y)
y-txtb-zcyi-axi.bg
i
What’s*the*dimension*of*matrix*XTX?*
What’s*the*dimension*of*matrix*XTX?*
Is*this*statement*true?*
If!the!matrix!XTX!does!NOT!have!zero!valued!eigenvalues,! it!is!inverOble.!
T
X x
symmetric , d xd
det to
detcxtxl
> o
Is*this*statement*true?*
If!the!matrix!XTX!does!NOT!have!zero!valued!eigenvalues,! it!is!inverOble.!
Training*using*least*squares*example*
Model:!!
1! 3! 0! 2! 3! 2! 3! 6! 5!
y
x(1) x(2)
y = xTβ + ξ = x(1)β1 + x(2)β2 + ξ Training!data!
3
=
−1
3
Prediction*
If!we!train!the!model!coefficients!!!!!,!we!can!predict!!!
from!!
In!the!model!!!!!!!!!!!!!!!!!!!!!!!!!!!!!!!!!!!!!!!!!!!!with!!
The!predicOon!for!!!!!!!!!!!!!!!!!!!is!! The!predicOon!for!!!!!!!!!!!!!!!!!!!is!!
yp
x0
y = x(1)β1 + x(2)β2 + ξ
−1
3
0 = xT
β
x0 =
1
yp
=
2×2-1 IN
= oxzx
y:c: )
A*linear*model*with*constant*offset*
The!problem!with!the!model!!!!!!!!!!!!!!!!!!!!!!!!!!!!!!!!!!!!!!!!!!!!
is:it!always!predicts!!!!!!=!0!if!the!input!vector!
!Let’s!add!a!constant!offset!!!!!!to!the!model!
y = x(1)β1 + x(2)β2 + ξ
yp
x0 =
β0
Training*and*prediction*with*constant*
1% 1! 1! 3! 0! 1! 2! 3! 2! 1! 3! 6! 5!
x(1) x(2)
y
y = β0 + x(1)β1 + x(2)β2 + ξ = xTβ + ξ
The!model!! Training!data:! For!!
1 x(1) x(2)
−3 2
1 3
x0 =
0 =
−3 2
1 3
= −3
Variance*of*the*linear*regression*model*
The!least!squares!esOmate!saOsfies!this!property!! The!random!error!is!uncorrelated!to!the!least!square!
soluOon!of!linear!combinaOon!of!explanatory! variables.! var({yi}) = var({xT
i
β}) + var({ξi})
→ van [ Xt 'll =uarCX7tuwCY ,
if
X, 'T cure
cleanroom
. Variance*of*the*linear*regression*model:* proof*
The!least!squares!esOmate!saOsfies!this!property!!
!! var({yi}) = var({xT
i
β}) + var({ξi})
y = X · β + e
var[y] = (1/N)(y − y)T(y − y)
Proof:%
var[y] = (1/N)([X ˆ β − X ˆ β] + [e − e])T([X ˆ β − X ˆ β] + [e − e])
⌃! Cov Cx
, 71 =KI Ye
Variance*of*the*linear*regression*model:* proof*
The!least!squares!esOmate!saOsfies!this!property!!
!! var({yi}) = var({xT
i
β}) + var({ξi}) Proof:%
var[y] = (1/N)([X ˆ β − X ˆ β] + [e − e])T([X ˆ β − X ˆ β] + [e − e])
Variance*of*the*linear*regression*model:* proof*
The!least!squares!esOmate!saOsfies!this!property!!
!! var({yi}) = var({xT
i
β}) + var({ξi}) Proof:%
var[y] = (1/N)([X ˆ β − X ˆ β] + [e − e])T([X ˆ β − X ˆ β] + [e − e])
var[y] = (1/N)([X ˆ β−X ˆ β]T[X ˆ β−X ˆ β]+2[e−e]T[X ˆ β−X ˆ β]+[e−e]T[e−e])
[ e- E) THE - xpti-cxp-xp.IT e-ET
scalar
if
Ct
CT
is
scalar
( =
CT
Variance*of*the*linear*regression*model:* proof*
The!least!squares!esOmate!saOsfies!this!property!!
!! var({yi}) = var({xT
i
β}) + var({ξi}) Proof:%
var[y] = (1/N)([X ˆ β − X ˆ β] + [e − e])T([X ˆ β − X ˆ β] + [e − e])
var[y] = (1/N)([X ˆ β−X ˆ β]T[X ˆ β−X ˆ β]+2[e−e]T[X ˆ β−X ˆ β]+[e−e]T[e−e])
Because!!!!!!!!!!!!!!!!!!!!;!!!!!!!!!!!!!!!!!!!!!!!!!!!!!!!!;!!
e = 0
eT1 = 0
eTX β = 0
Variance*of*the*linear*regression*model:* proof*
The!least!squares!esOmate!saOsfies!this!property!!
!! var({yi}) = var({xT
i
β}) + var({ξi}) Proof:%
var[y] = (1/N)([X ˆ β − X ˆ β] + [e − e])T([X ˆ β − X ˆ β] + [e − e])
var[y] = (1/N)([X ˆ β−X ˆ β]T[X ˆ β−X ˆ β]+2[e−e]T[X ˆ β−X ˆ β]+[e−e]T[e−e])
var[y] = (1/N)([X ˆ β − X ˆ β]T[X ˆ β − X ˆ β] + [e − e]T[e − e])
Because!!!!!!!!!!!!!!!!!!!!;!!!!!!!!!!!!!!!!!!!!!!!!!!!!!!!!!and!!
e = 0
eT1 = 0
eTX β = 0
Due!to!Least!square!minimized!
Variance*of*the*linear*regression*model:* proof*
The!least!squares!esOmate!saOsfies!this!property!!
!! var({yi}) = var({xT
i
β}) + var({ξi}) Proof:%
var[y] = (1/N)([X ˆ β − X ˆ β] + [e − e])T([X ˆ β − X ˆ β] + [e − e])
var[y] = (1/N)([X ˆ β−X ˆ β]T[X ˆ β−X ˆ β]+2[e−e]T[X ˆ β−X ˆ β]+[e−e]T[e−e])
Because!!!!!!!!!!!!!!!!!!!!;!!!!!!!!!!!!!!!!!!!!!!!!!!!!!!!!!and!!
e = 0
eT1 = 0
var[y] = (1/N)([X ˆ β − X ˆ β]T[X ˆ β − X ˆ β] + [e − e]T[e − e]) eTX β = 0
= var[X β] + var[e]
Due!to!Least!square!minimized!
var[y]
Evaluating*models*using*RRsquared*
The!least!squares!esOmate!saOsfies!this!property!! This!property!gives!us!an!evaluaOon!metric!called!R5
squared!
We!have!!!!!!!!!!!!!!!!!!!!!!!!!!!with!a!larger!value!meaning!a!
beler!fit.!
!!
var({yi}) = var({xT
i
β}) + var({ξi})
R2 = var({xT
i
β}) var({yi})
0 ≤ R2 ≤ 1
Q:*What*is*RRsquared*if*there*is*only*one* explanatory*variable*in*the*model?*
Q:*What*is*RRsquared*if*there*is*only*one* explanatory*variable*in*the*model?*
R5squared!would!be!the%correlaTon% coefficient%squared!(textbook!pgs!43544)!
RRsquared*examples*
Comparing*our*example*models*
1! 3! 0! 1! 2! 3! 2! 3! 3! 6! 5! 4!
x(1) x(2)
y xT β
1% 1! 1! 3! 0! 0! 1! 2! 3! 2! 2! 1! 3! 6! 5! 5!
x(1) x(2)
y xT β
y = β0 + x(1)β1 + x(2)β2 + ξ
y = x(1)β1 + x(2)β2 + ξ
−1
3
−3 2
1 3
Linear*regression*model*for*the*Chicago* census*data*
Residual*is*normally*distributed?*
The!Q5Q!plot!of! the!residuals!is! roughly!normal!
Prediction*for*another*community*
[1]!"PERCENT_OF_HOUSING_CROWDED"!!!!!!!!!!!!!!!!!!!!! [2]"PERCENT_HOUSEHOLDS_BELOW_POVERTY "!!!!!!!!!!!!! [3]!"PERCENT_AGED_16p_UNEMPLOYED"!!!!!!!!!!!!!!!!!!! [4]"PERCENT_AGED_25p_WITHOUT_HIGH_SC HOOL_DIPLOMA"! [5]! "PERCENT_AGED_UNDER_18_OR_OVER_64"!!!!!!!!!!!!!! [6]"PER_CAPITA_INCOME"!!!!!!!!!!!!!!!!!!!!!!!!!!!! 4.7% 19.7% 12.9% 19.5% 33.5% Log(28202)% Predicted!hardship!index:!41.46038% Note:!maximum!of!hardship!index!in!the!training!data!is!98,!minimum!is!1!
The*clusters*of*the*Chicago*communities:* clusters*and*hardship*
Clusters%of%community% Hardship%index%of%communiTes%
The*clusters*of*the*Chicago*communities:* per*capital*income*and*hardship*
PER_CAPITAL_INCOME% Hardship%index%of%communiTes%
The*clusters*of*the*Chicago*communities:* without*diploma*and*hardship*
Hardship%index%of%communiTes%
PERCENT_AGED_25p_WITHOUT _HIGH_SCHOOL_DIPLOMA%
Assignments*
Read!Chapter!13!of!the!textbook! Next!Ome:!More!on!linear!regression!
!
P lol b) = PCD lol Pco,
O'
PCD)
.
Pirlo
' =L
Pl D) = I PCDIO) pco,
=PCD to Pco
Additional*References*
✺ Robert!V.!Hogg,!Elliot!A.!Tanis!and!Dale!L.!
Zimmerman.!“Probability!and!StaOsOcal! Inference”!!
Kelvin!Murphy,!“Machine!learning,!A!
ProbabilisOc!perspecOve”!
See*you*next*time*
See You!