
SLIDE 1
ì
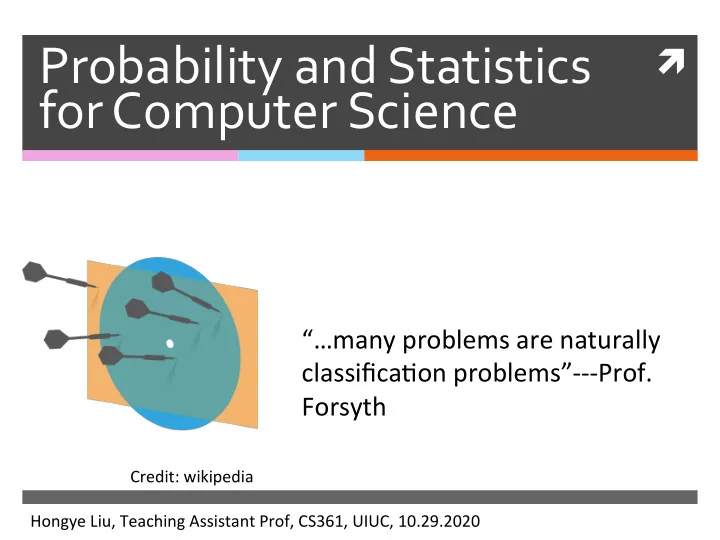
Probability and Statistics for Computer Science
“…many problems are naturally classifica4on problems”---Prof. Forsyth
Hongye Liu, Teaching Assistant Prof, CS361, UIUC, 10.29.2020 Credit: wikipedia
Probability and Statistics for Computer Science many problems are - - PowerPoint PPT Presentation
Probability and Statistics for Computer Science many problems are naturally classifica4on problems---Prof. Forsyth Credit: wikipedia Hongye Liu, Teaching Assistant Prof, CS361, UIUC, 10.29.2020 Last time Review of Covariance
“…many problems are naturally classifica4on problems”---Prof. Forsyth
Hongye Liu, Teaching Assistant Prof, CS361, UIUC, 10.29.2020 Credit: wikipedia
✺ There are 38816 white
blood immune cells from a mouse sample
✺ Each immune cell has
40+ features/ components
✺ Four features are used
as illustra4on.
✺ There are at least 3 cell
types involved
T cells B cells Natural killer cells
✺ There are 38816 white
blood immune cells from a mouse sample
✺ Each immune cell has
40+ features/ components
✺ Four features are used
as illustra4on.
✺ There are at least 3 cell
types involved
Dark red: T cells Brown: B cells Blue: NK cells Cyan: other small popula4on
> res1 $values [1] 4.7642829 2.1486896 1.3730662 0.4968255 $vectors [,1] [,2] [,3] [,4] [1,] 0.2476698 0.00801294 -0.6822740 0.6878210 [2,] 0.3389872 -0.72010997 -0.3691532
[3,] -0.8298232 0.01550840 -0.5156117
[4,] 0.3676152 0.69364033 -0.3638306
Eigenvalues Eigenvectors
✺ There are 38816 white
blood immune cells from a mouse sample
✺ Each immune cell has 42
features/components
✺ There are at least 3 cell
types involved
T cells B cells Natural killer cells
Principal component 1 is just cell length
✺ Some4mes we need to scale the data for each feature
have very different value range.
✺ Afer scaling the eigenvalues may change significantly. ✺ Data needs to be inves4gated case by case
Eigenvalues do not drop
quickly
Even the first 2 PCs don’t separate the different types
✺ Given a set of feature vectors xi, where each has a class
label yi, we want to train a classifier that maps unlabeled data with the same features to its label.
CD45 CD19 CD11b CD3e Type
6.59564671 1.297765164 7.073280884 1.155202366
1
6.742586812 4.692018952 3.145976639 1.572686963
4
6.300680301 1.20613983 6.393630905 1.424572629
2
5.455310882 0.958837541 6.149306002 1.493503124
1
5.725565772 1.719787885 5.998232014 1.310208305
1
5.552847151 0.881373587 6.02155471 0.881373587
3
✺ A binary classifier maps each feature vector to one of
two classes.
✺ For example, you can train the classifier to:
✺ Predict a gain or loss of an investment ✺ Predict if a gene is beneficial to survival or not ✺ …
✺ A mul4class classifier maps each feature vector to one
✺ For example, you can train the classifier to:
✺ Predict the cell type given cells’ measurement ✺ Predict if an image is showing tree, or flower or car, etc ✺ ...
✺ We will cover classifiers such as nearest
✺ Given an unlabeled feature vector
✺ Calculate the distance from x ✺ Find the closest labeled xi ✺ Assign the same label to x
✺ Prac4cal issues
✺ We need a distance metric ✺ We should first standardize the data ✺ Classifica4on may be less effec4ve for very high
dimensions
Source: wikipedia
✺ In k-nearest neighbors, the classifier:
✺ Looks at the k nearest labeled
feature vectors xi
✺ Assigns a label to x based on a
majority vote
✺ In (k, l)-nearest neighbors, the classifier:
✺ Looks at the k nearest labeled feature vectors ✺ Assigns a label to x if at least l of them agree on the
classifica4on
✺ We want the classifier to avoid some mistakes on
unlabeled data that we will see in run 4me.
✺ Problem 1: some mistakes may be more costly than
We can tabulate the types of error and define a loss func4on
✺ Problem 2: It’s hard to know the true labels of the
run-4me data
We must separate the labeled data into a training set and test/valida4on set
✺ A binary classifier can make two types of errors
✺ False posi4ve (FP) ✺ False nega4ve (FN)
✺ Some4mes one type
✺ Drug effect test ✺ Crime detec4on ✺ We can tabulate the performance
in a class confusion matrix
15 3 7 25 FP TP TN FN
✺ A loss func4on assigns costs to mistakes ✺ The 0-1 loss func4on treats
FPs and FNs the same
✺ Assigns loss 1 to every
mistake
✺ Assigns loss 0 to every
correct decision
✺ Under the 0-1 loss func4on ✺ accuracy= ✺ The baseline is 50% which we get by
random decision.
TP + TN TP + TN + FP + FN
✺ Assuming there are c classes: ✺ The class confusion matrix is
c × c
✺ Under the 0-1 loss func4on
accuracy=
32/38=84% ✺ The baseline accuracy is 1/c.
sum of diagonal terms sum of all terms
Source: scikit-learn
✺ We expect a classifier to perform worse on run-4me data
✺
Some4mes it will perform much worse: an overfiDng in training
✺
An extreme case is: the classifier correctly labeled 100% when the input is in the training set, but otherwise makes a random guess ✺ To protect against overfisng, we separate training set
from valida4on/test set
✺
Training set for training the classifier
✺
ValidaHon/test set is for evalua4ng the performance ✺ It’s common to reserve at least 10% of the data for tes4ng
✺ If we don’t want to “waste” labeled data on valida4on, we
can use cross-validaHon to see if our training method is sound.
✺ Split the labeled data into training and valida4on sets in
mul4ple ways
✺ For each split (called a fold)
✺
Train a classifier on the training set
✺
Evaluate its accuracy on the valida4on set ✺ Average the accuracy to evaluate the training
methodology
If I have a data set that has 50 labeled data entries, how many leave-one-out valida4ons I can have?
If I have a data set that has 51 labeled data entries, I divide them into three folds (17,17,17). How many trained models can I have?
*The common pracHce of using fold is to divide the samples into equal sized k groups and reserve one of the group as the test data set.
✺
Lec 11-Lec 18, Chapter 6-10