SLIDE 1
Estimating Hierarchical Structure GLMM Item Response Models in R
Ivailo Partchev Paul De Boeck International Workshop on Psychometric Computing Innsbruck, February 9–10, 2011
Previous work
◮ De Boeck P
, Wilson M (2004). Explanatory Item Response Models: A Generalized Linear and Nonlinear Approach. New York:Springer.
◮ De Boeck P
, Bakker M, Zwitser R, Nivard M, Hofman A, T uerlinckx F , Partchev I (2011). “The Estimation of Item Response Models with the lmer Function from the lme4 Package in R.” Journal of Statistical Software, 39.
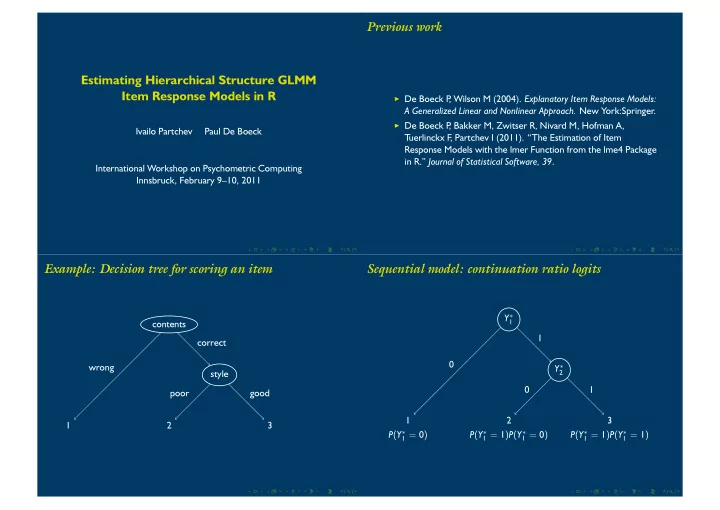
Example: Decision tree for scoring an item
1 2 3 style poor good contents wrong correct
Sequential model: continuation ratio logits
1 P(Y∗
1 = 0)
2 P(Y∗
1 = 1)P(Y∗ 1 = 0)
3 P(Y∗
1 = 1)P(Y∗ 1 = 1)
Y∗
2
1 Y∗
1
1
SLIDE 2
Partial credit model: adjacent logits
1 exp(0) 2 exp(0) exp(θ1 + β1) 3 exp(θ1 + β1) exp(θ2 + β2) style exp(0) exp(θ2 + β2) contents exp(0) exp(θ1 + β1)
Graded response model: cumulative logits
1 1 − R1 2 R1 − R2 3 R2 R2 poor good R1 wrong correct
Another example: Slow and fast intelligence
1 1 → 00• 2 2 → 01• 3 3 → 1 • 0 4 4 → 1 • 1 θ2 + β2 wrong correct θ3 + β3 wrong correct θ1 + β1 slow fast
Research issue
Does the intelligence involved in fast correct responses differ in nature from the intelligence involved in slow correct responses with respect to:
◮ the processes involved? ◮ the abilities involved?
Or, more simply,
◮ Is fast intelligence the same as slow intelligence: θ2 = θ3? ◮ Is fast difficulty the same as slow difficulty: β2 = β3?
SLIDE 3 Material
◮ A verbal analogies test (Hornke & Rettig, 1993): proportions of
success from 0.026 to 0.985, mean response time 18 s (SD 15.7); relibility of fast responses 0.746 (within-person split), 0.701 (within-item split); relibility of slow responses 0.705 (within-person split), 0.643 (within-item split), for a subset of 726 persons and 34 items
◮ A Raven-type matrices test (Hornke & Habon, 1986):
proportions of success from 0.102 to 0.772, mean response time 69 s (SD 51.5); relibility of fast responses 0.727 (within-person split), 0.768 (within-item split); relibility of slow responses 0.679 (within-person split), 0.630 (within-item split), for a subset of 503 persons and 35 items
Analyses with ConQuest
◮ Fixed effects for items, random effects for persons ◮ Full model 3I–3P compared with constrained models 2I–3P
, 3I–2P , and 2I–2P
◮ Full model fit satisfactory; relative fit of constrained models
significantly worse
Analyses with ConQuest
◮ Fixed effects for items, random effects for persons ◮ Full model 3I–3P compared with constrained models 2I–3P
, 3I–2P , and 2I–2P
◮ Full model fit satisfactory; relative fit of constrained models
significantly worse
◮ Correlations between the two accuracy abilities high but not
perfect: 0.873 and 0.879 for verbal analogies and 0.880 and 0.869 for matrices, for the split within persons and within items, respectively
◮ Estimated variances larger for fast than for slow
◮ verbal analogies: 1.19 (slow) 2.77 (fast) with a split within
persons, 1.22 (slow) 2.02 (fast) with a split within items
◮ verbal analogies: 0.85 (slow) 1.71 (fast) with a split within
persons, 1.02 (slow) 1.59 (fast) with a split within items
SLIDE 4
Analyses with glmer
◮ Determine whether the difference in fit is due primarily to the
imperfect correlation or to the difference in reliability
◮ Random parameters for both persons and items ◮ Reparameterization of slow and fast accuracy as a general
accuracy and a specific variable for fast accuracy
◮ Correlations between general and specific: 0.767 (verbal) and
0.646 (matrices) for ability, 0.661 (verbal) and 0.590 (matrices) for items, so the variance of the fast latent variable appears to be consistently higher than the variance of the slow latent variable
◮ For items, a positive relationship between speed: easy items are
faster, difficult items take more time.
◮ For persons, results depend on the kind of test: for matrices,
successful respondents are slower; for verbal analogies, being relatively more successful with fast responses is positively correlated with overall speed, so it often does not help to use more time.
Conclusions
◮ The glmer function from lme4 can be used to estimate IR models
with ordinal items; the ‘difficulty’ is mainly in reshaping the data in the appropriate way
◮ A wider variety of decision trees can lead to a much broader
scope of useful psychometric models
◮ One substantive result is that fast and slow intelligence can be
differentiated with respect to both the processes involved and to the corresponding abilities