SLIDE 1
Preview of Advancing Preconstruction & Estimating Presentation on Construction Inflation & Forecasting 5-22-19
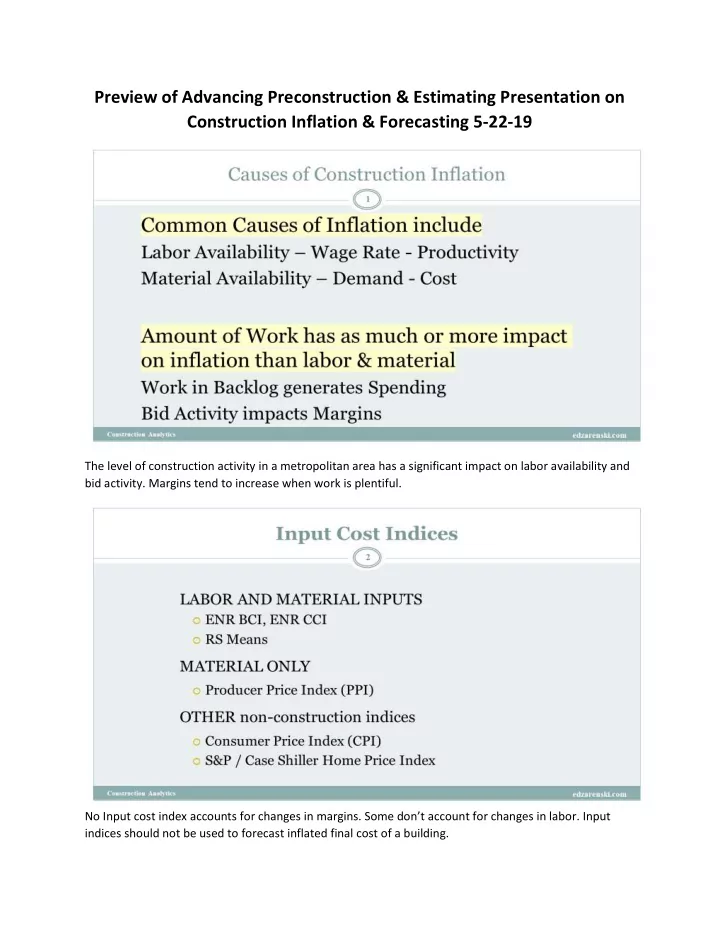
The level of construction activity in a metropolitan area has a significant impact on labor availability and bid activity. Margins tend to increase when work is plentiful. No Input cost index accounts for changes in margins. Some don’t account for changes in labor. Input indices should not be used to forecast inflated final cost of a building.
SLIDE 2
PPI contractors and buildings indices attempt to account for all final cost. All other PPI indices are input costs at various levels of input. Some of them represent pre-wholesale cost changes. This compares nonresidential final cost indices to an input index. Since 2011, if you inflated cost using ENR-BCI (red line) you would have undercut real cost by 12% compared to final cost index (black line).
SLIDE 3 Notice in this plot Input indices ENR and RSMeans for 2010 to 2017 increased only from 85 to 100, 17%
- growth. Final cost indices increased from 77 to 100, 30% growth.
SLIDE 4
For nonresidential work we have 70% to 80% of expected spending this year already in backlog as the year began. For new starts within the year, approximately 20% of the spending occurs in the year started, 50% in the next year, 25% in the third year. This means nonresidential spending growth in 2019 is still being affected by starts from 2016. Large increases in starts could be a change in share of market captured. Starts share of market must be considered before using starts to forecast future spending.
SLIDE 5
2019 spending growth forecast at +3.0%, but Inflation is predicted to average 4.3%. Real Volume declines by 1.3%. Major growth in Highway, Public Works Amusement/Recreation. Business planning choices made on data unadjusted could lead to improper business decisions.
SLIDE 6
Real Volume is still 15% below previous peak high in 2005. Volume is not growing as fast as spending (or Revenue) would indicate. Prior to recession, in 2003-2007, spending was increasing 10%+/year. Jobs increased +15% in 3 years. But inflation was 8%+/year. Real volume increased only 2% in 3 years. High rate of spending led to excess jobs growth.
SLIDE 7
Construction added 1.6 million jobs in 6yrs 2013-2018, the fastest rate of jobs growth since 1995-2000. 29% growth in jobs but only 25% growth in real volume after inflation.