
SLIDE 1
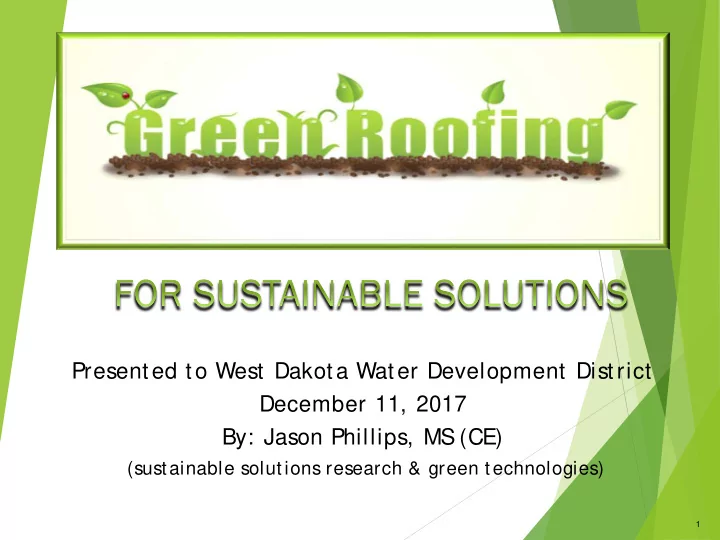
Presented to West Dakota Water Development District December 11, 2017 By: Jason Phillips, MS (CE)
(sustainable solutions research & green technologies)
1
Presented to West Dakota Water Development District December 11, - - PowerPoint PPT Presentation
Presented to West Dakota Water Development District December 11, 2017 By: Jason Phillips, MS (CE) (sustainable solutions research & green technologies) 1 Why Green Roofs? The Need For Research Research Objectives Benefits
1
2
3
4
5
5 10 15 20 25 30 35 12:00 12:30 13:00 13:30 14:00 14:30 15:00 15:30
Volume (gal)
Time (MST)
Control (Shingled) German(FLL) Non-German(GreenGrid)
2 4 6 8 10 15:36 16:04 16:33 17:02 17:31 18:00 18:28 Volume (gallons) Time of day (MST)
Control (asphalt roof) Non-German German
6
7
8
9
10
11
12
13
14
15
10/2/2015 (0.1 in) 3/24/2016 (0.2 in) 5/25/2016 (0.2 in) 6/14/2016 (0.4 in) Asphalt 362.4 247.48 355.8 401.0 German 46.4 51.97 55.24 209.9 non-German 108.7 106.93 67.3 277.8 50 100 150 200 250 300 350 400 450
10/2/2015 (0.1 in) 3/24/2016 (0.2 in) 5/25/2016 (0.2 in) 6/14/2016 (0.4 in) Asphalt 166.7 33.51 41.6 37.9 German 39.7 17.32 7.77 18.5 non-German 45.3 29.16 8.7 27.3 20 40 60 80 100 120 140 160 180
16
17
18
19
20
21
22
23
24
25
26
27
28
29
30
31
32
33
34
35