
SLIDE 1
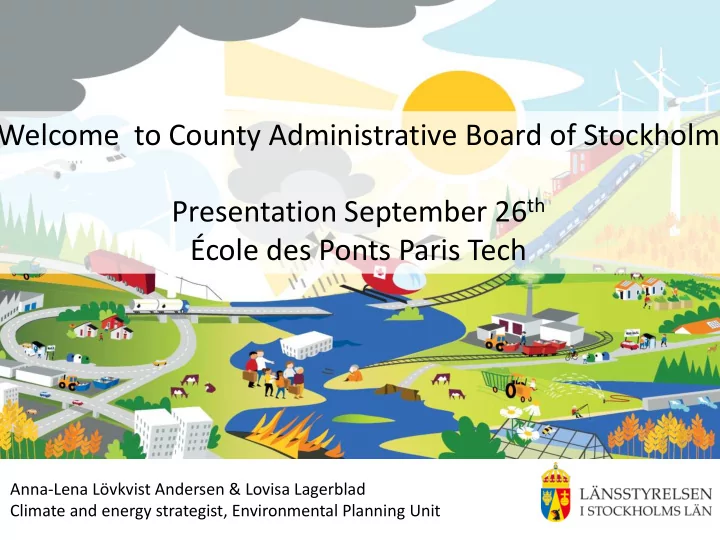
Welcome to County Administrative Board of Stockholm Presentation September 26th École des Ponts Paris Tech
Anna-Lena Lövkvist Andersen & Lovisa Lagerblad Climate and energy strategist, Environmental Planning Unit
Presentation September 26 th cole des Ponts Paris Tech Anna-Lena - - PowerPoint PPT Presentation
Welcome to County Administrative Board of Stockholm Presentation September 26 th cole des Ponts Paris Tech Anna-Lena Lvkvist Andersen & Lovisa Lagerblad Climate and energy strategist, Environmental Planning Unit Sweden s environ-
Anna-Lena Lövkvist Andersen & Lovisa Lagerblad Climate and energy strategist, Environmental Planning Unit
The Swedish Parliament has set a number of environmental
sustainable development. These goals guide environ- mental efforts in Sweden. They point the way to a sustainable society.
“The overall goal of Swedish environmental policy is to hand
society in which the major environmental problems in Sweden have been solved, without increasing environ- mental and health problems
RIKSDAG DECISION ON THE ENVIRONMENTAL OBJECTIVES
PHOTO: ELLIOT ELLIOT/JOHNÉR – Ecosystems are on the way to recovery – Biodiversity and the natural and cultural environment are conserved – Human health is subject to a minimum of adverse impacts from factors in the environment – Materials cycles are resource-efficient and, as far as possible, free from dangerous substances – Natural resources are managed sustainably – The share of renewable energy increases and use of energy is efficient – Patterns of consumption of goods and services cause the least possible problems for the environment and human health
The Riksdag has adopted 16 objectives for environmental quality in Sweden
Reduced Climate Impact Clean Air Natural Acidification Only A Non-Toxic Environment A Protective Ozone Layer A Safe Radiation Environment Zero Eutrophication Flourishing Lakes and Streams Good-Quality Groundwater
A Balanced Marine Environment, Flourishing Coastal Areas and Archipelagos
Thriving Wetlands Sustainable Forests A Varied Agricultural Landscape A Magnificent Mountain Landscape A Good Built Environment A Rich Diversity of Plant and Animal Life
ILLUSTRATIONS: TOBIAS FLYGAR – promoting cooperation at several levels
The business sector, stakeholder
the public are crucial to achieving the
sju huvudansvariga myndigheter
i miljömålssystemet
länsstyrelser
kommuner
Eight national lead agencies
responsibilities within the environmental
County administrative boards
Local authorities (municipalities)
The UN Framework Convention on Climate Change provides for the stabilization of concentrations of greenhouse gases in the atmosphere at levels which ensure that human activities do not have a harmful impact on the climate system. This goal must be achieved in such a way and at such a pace that biological diversity is preserved, food production is assured and other goals
countries, must assume responsibility for achieving this global objective.
ILLUSTRATIONS: TOBIAS FLYGAR. PHOTO: HANS GEIJER/JOHNER – VERY DIFFICULT TO ACHIEVE
50–70 per cent from 1990 levels by 2050, and must be close to zero by the end of the century.
efficient use of energy is needed.
Energy supply (630 TWh in 2006) based on
Swedish energy system’s particularities
Electricity supply is > 98% CO2 neutral Natural gas only at West Coast (Malmö-Gothenburg) Wind power will be further developed (20 TWh goal 2020) Solar energy nearly non-existent
CO2 emissions Hydro electric power supply
Indicator France Sweden Population (million) 65,5 9,3 Electricity (total prod. GWh) 569 840 148 850 Share of fossil sources 11 % 3 % Renewable sources 12 % 52 % Nuclear power 77 % 45 %
BUT: Energy consumption in Sweden/per capita is one of the highest in the world!
Sources: EU Commission, SCB
The County Administrative Board, in collaboration with the county's municipalities, authorities and industry, has developed a climate and energy strategy that shows how we can help attain climate targets and energy conversion.
.
systems
landuse
cooling systems
pellets and heat pumps
products
Stockholm region compared to nation
Sweden Stockholm county Share of Stockholm (%) Population (million) 9,3 2,0 22 BNP (billion SEK) 2 750 770 28 Energy use (TWh)* 624 55 9 CO2 eq emissions (mil ton) 67 8,5 12,5 KWh/capita 69 000 29 000 42 CO2 eq/ton*capita 7,4 4,5 61
* Incl. losses of nuclear power and distribution
systems
10 20 30 40 50 60 2005 2020 2030 2050 TWh år
Tillförd energi, målbild mot 2005
Jordbruk och skogsbruk Transport Industri Byggd mijlö och service Energisektor (förluster+prod. el)
Total amount of energy, compared to 2005
Agriculture Transport Industry Buildings Losses
CO2ekv utsläpp, målbild, jämfört med 2006 års utsläpp
0,0 1,0 2,0 3,0 4,0 5,0 6,0 7,0 8,0 9,0 2006 2020 2030 2050 år miljoner ton CO2ekv Övriga klimatgaser Jordbruk och skogsbruk Transport Industri Byggd mijlö och service Energisektor
Total emissions of CO2, compared to 2006
Other GHGs Agriculture Transport Industry Buildings Losses
Million tons of CO2 eq.
Million inhabitants of Stockholm county
Example: Public transport – fossil free 2025
public transport
”green electricity” Buses:
= 700 out of 1,800 buses (40 %)
50 % biogas/ethanol by 2011
2025
Example: Combining settlement and transport infrastructure development
development based on public transport
green spaces
systems
agenda and requires new comprehensive strategies and measures
be considerable, private sector very important
enough to make big steps forward
trend shift necessary
– 26 municipalities – 2 million inhabitants or 1/5 of Sweden’s population – Lake Mälaren and the Baltic Sea
climate change adaptation and climate and energy
change
gas emission
2-3 min
2-3 min
change
gas emission