
SLIDE 1
Financial results presentation
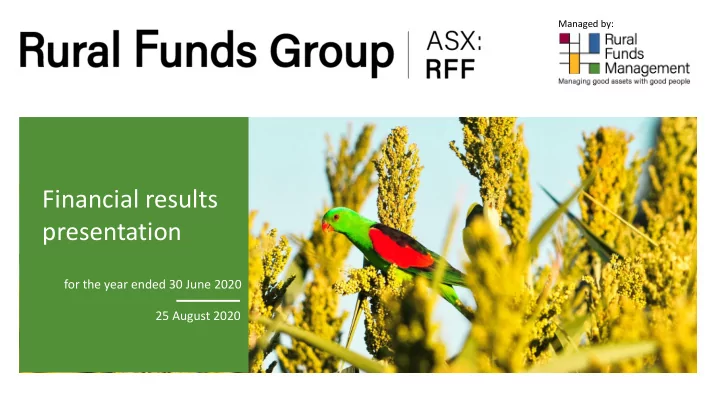
for the year ended 30 June 2020 25 August 2020
Managed by:
presentation for the year ended 30 June 2020 25 August 2020 - - PowerPoint PPT Presentation
Managed by: Financial results presentation for the year ended 30 June 2020 25 August 2020 Disclaimer and glossary of terms Disclaimer This presentation has been prepared by Rural Funds Management Limited (ACN 077 492 838, AFSL 226 701) ( RFM )
for the year ended 30 June 2020 25 August 2020
Managed by:
Disclaimer This presentation has been prepared by Rural Funds Management Limited (ACN 077 492 838, AFSL 226 701) (RFM) as the responsible entity of Rural Funds Group (RFF) and has been authorised for release by the Board of RFM. RFF is a stapled security, incorporating Rural Funds Trust (ARSN 112 951 578) and RF Active (ARSN 168 740 805). The information contained in this presentation is not investment or financial product advice and is not intended to be used as the basis for making an investment decision. Please note that, in providing this presentation, RFM has not considered the investment objectives, financial circumstances or particular needs of any particular recipients. This presentation is not, and does not, constitute an offer to sell or the solicitation, invitation or recommendation to purchase any securities, and neither this presentation nor anything contained herein shall form the basis of any contract or commitment. In particular, this presentation does not constitute an offer to sell, or a solicitation of an offer to buy, any securities in the United States. This presentation must not be released or distributed in the United States. Any securities described in this presentation have not been, and will not be, registered under the US Securities Act of 1933 and may not be offered or sold in the United States except in transactions exempt from, or not subject to, registration under the US Securities Act and applicable US state securities laws. RFM has prepared this presentation based on information available to it at the time of preparation. No representation or warranty is made as to the fairness, accuracy or completeness of the information,
employees and advisers are not liable for any direct, indirect or consequential loss or damage suffered by any person as a result of relying on this presentation or otherwise in connection with it. This presentation includes “forward-looking statements”. These forward-looking statements are based on current views, expectations and beliefs as at the date they are expressed. They involve known and unknown risks, uncertainties and other factors that could cause the actual results, performance or achievements of RFF to be materially different from those expressed or implied by the forward-looking
responsibility for the accuracy or completeness of any forward-looking statements. Glossary Adjusted NAV - Net Asset Value (NAV) adjusted for the independent valuation of water entitlements; Adjusted total assets - Total assets adjusted for the independent valuation of water entitlements; ASX - Australian Securities Exchange; AFFO - Adjusted funds from operations, a financial metric used in the REIT sector to measure available cash flow from operations (adjustment relates to non-cash tax expense); CAGR - Compound annual growth rate; Counterpart - A party other than RFF involved in a financial transaction, usually referring to the lessee of a property; CPI - Consumer Price Index; DPU - Distributions per Unit; EBITDA - Earnings Before Interest, Taxes, Depreciation and Amortisation; Fair value - Value of an asset as determined by an independent valuation; Gearing - Calculated as external borrowings/adjusted total assets; Group - Term used for the Rural Funds Group; ha - Hectare(s); LVR - Loan to valuation ratio, a bank covenant calculated as debt divided by tangible assets (including water entitlements); ML - Megalitre; m - Million(s); NAV - Net asset value, calculated as assets less the value of liabilities (does not recognise fair value of water entitlements); Pro forma - Financial statements based
Trust; RFF - Rural Funds Group (ASX:RFF); RFM - Rural Funds Management Limited, manager and responsible entity for the Rural Funds Group.
Cover image: Red-winged parrots (Aprosmictus erythropterus) perched on forage Sorghum at Comanche, central Queensland, August 2020.
2
1. Financial results 2. Capital management 3. Portfolio update and forecasts 4. Conclusion 5. Appendices
James Powell
Managing Director Chief Operating Officer Chief Financial Officer General Manager – Investor Relations & Marketing
David Bryant Tim Sheridan Daniel Yap
3
Pruned shiraz grapevines at Kleinig vineyard, Barossa Valley, South Australia, August 2020.
4
Recycling capital into growth assets.
Adjusted property assets movements ($m) by category1
a) Disposals: sale of poultry assets for $74.7m and unencumbered ground water entitlement for $6.7m. b) Cattle: acquisitions totaling $67.7m (eight properties and feedlots), revaluations of $14.3m and development capex of $3.9m.2 c) Almonds: revaluations of $22.3m3 (three orchards) and capex of $10.8m, net of bearer plant depreciation of $3.6m.4 d) Macadamias: acquisition of two sugar cane farms (to develop to macadamia orchards) and a macadamia tree nursery totalling $5.4m, revaluations of $1.5m and capex of $1.3m, net of bearer plant depreciation of $0.2m.5 e) Water: revaluations of unleased water entitlements of $20.7m. f) Vineyards: capex of $0.5m net of bearer plants depreciation of $0.9m.4 g) Pro forma acquisitions: Maryborough cropping properties (expected to settle October 2020) and Rockhampton cattle property (expected to settle December 2020). See page 11 for further details. h) Pro forma disposal: contracts exchanged for Mooral almond orchard (expected to settle December 2020). See page 12 for further details.
Notes: 1. The sector totals presented in the chart are net of written-off transaction costs and inclusive of capex. Acquisition amounts include stamp duty. Revaluations include straight-lining adjustment for rent and finance lease adjustments. Agricultural plant and equipment of $7.0m is excluded. 2. Acquisitions: Beef City feedlot and adjacent land (Aug 2019 $12.8m and Oct 2019 $0.5m), WA cattle properties (Feb 2020 $22.6m), Wattlebank (Jan 2020 $1.8m), Riverina Beef feedlot (May 2020 $11.6m), Yarra (May 2020 $7.6m), Homehill (Jun 2020 $8.7m) and cattle ($2.1m). Revaluations includes properties revaluations of $12.9m, feedlot finance income of $0.8m and straight-lining adjustment for rent of $0.6m. 3. Properties valuations of $21.7m and straight-lining adjustment for rent of $0.6m. 4. Directors’ valuation applied to bearer plants, which are treated as property, plant and equipment and depreciated in accordance with AASB116. 5. Acquisitions: Cygnet (Oct 2019 $1.6m), Swan Ridge South (Mar 2020 $1.6m) and Nursery Farm (Mar 2020 $2.2m). Revaluation includes finance lease adjustments of $0.8m and properties revaluations of $0.7m.
5
Forecasts achieved, revenue and earnings increased.
Income and earnings metrics
(feedlot acquisitions and J&F Australia Pty Ltd Guarantee income), cattle property acquisitions, development capital expenditure and lease indexation.
revaluations for almond and macadamia orchards, cattle properties and water entitlements (see pages 17 and 22).
Balance sheet summary
12 months ended 30 June 2020 12 months ended 30 June 2019 Property revenue - $ 71,978,000 66,391,000 Total comprehensive income (TCI) - $ 61,938,000 33,078,000 Earnings per unit (EPU)1 - cents 18.43 10.14 Adjusted funds from operations (AFFO) - $ 45,427,000 43,246,000 AFFO per unit - cents 13.5 13.3 Distributions per unit (DPU) - cents 10.85 10.43 AFFO payout ratio 80% 78% As at 30 June 2020 As at 30 June 2019 Total assets - $ 914,920,000 869,087,000 Adjustment for water at fair value - $ 97,699,000 76,769,000 Adjusted total assets2 - $ 1,012,619,000 945,856,000 External borrowings - $ 301,023,000 295,238,000 Gearing3 - $ 29.7% 31.2% Net asset value (NAV) - $ 557,966,000 525,872,000 NAV per unit - $ 1.65 1.57 Adjusted NAV2 - $ 655,665,000 602,641,000 Adjusted NAV per unit1 - $ 1.94 1.80
Notes: 1. Calculated TCI/weighted average units (see page 17). 2. Assets adjusted for the independent valuation of water entitlements which are recognised at the lower of cost or fair value on balance sheet. 3. Gearing calculated as external borrowings/adjusted total assets.
6
Beehives adjacent to almond trees in bloom. Striping shows the variation in blossom times caused by different varieties. This creates a longer bloom and pollination period. Mooral, Hillston NSW, August 2020.
7
Limit and tenor being increased.
Item Details Trading price Decrease of 16.5% ($2.30 to $1.92) for 28 June 2019 to 30 June 2020. Current price $2.19 (21 August 2020). Distribution Forecast FY21 DPU of 11.28 cents. An increase of 4% from FY20 and in line with target growth. DRP Remains open with 1.5% discount. FY20 average DRP participation 18.4%. Equity raised Last equity raise July 2018: $149.5m at $1.95 per unit to fund JBS transactions and cattle property purchase.
Equity
Item Details Facility RFM has commenced discussions with financiers to refinance the $225.0m facility due to expire in FY22. RFM expects to complete the negotiations by 2020 calendar year end. Limit Current facility limit increase of $65.0m (to $400.0m) approved to fund Maryborough properties, with a further $50.0m approved for future acquisitions. Maturity Expiry date November 2021 ($225.0m) and November 2023 ($110.0m). Hedging Additional interest rate hedges totalling $60.0m entered into during the period; all commencing in December 2025 with 7 year duration; weighted average fixed rate 1.5%.
Debt Total securityholder return: RFF and S&P/ASX 300 A-REIT accumulation index 1 July 2014 to 21 August 20201
Note: 1. S&P/ASX 300 A-REIT Accumulation Index rebased to $1.00. RFF accumulation return rebased to $1.00 and assumes dividends reinvested.
RFF (dividends reinvested) S&P/ASX300 A-REIT accumulation index
8
$0.00 $0.50 $1.00 $1.50 $2.00 $2.50 $3.00 $3.50 $4.00 Jul-14 Jul-15 Jul-16 Jul-17 Jul-18 Jul-19 Jul-20 $3.29 +257.4% $1.45 +57.6%
Debt facility metrics
Reduced debt costs.
Proforma 30 June 20208 30 June 2020 30 June 2019 Debt facility Term debt facility limit1, 2 $400.0m $335.0m $335.0m Term debt drawn $285.9m $297.2m $291.4m Headroom $114.1m $37.8m $43.6m Cost of debt3 3.74% 3.74% 4.18% Covenants Loan to Value Ratio (LVR)1, 4 37.6% 39.1% 40.7% Interest Cover Ratio (ICR)1 5.85 5.85 5.76
$655.7m $655.7m $590.1m Hedging Total amount hedged5 $183.0m $183.0m $163.0m Proportion debt hedged1, 6 64.0% 61.6% 55.9% Weighted avg duration7 8.5yrs 8.5yrs 8.0yrs
Debt facility tenor (at 30 June 2020)
183.0 183.0 183.0 183.0 183.0 3.06% 3.06% 3.06% 3.06% 3.06% 3.00% 3.05% 3.10% 3.15% 3.20% $150m $160m $170m $180m $190m $200m FY21 FY22 FY23 FY24 FY25
Average hedged amount (LHS) Weighted average hedge rate (RHS)
Five year hedged (fixed rate) position
Notes: 1. Key financial covenants for FY20: LVR <50%, ICR >3.00x, with distribution permitted at >3.15x, Adj. NTA including water entitlements >$400m, 40% hedging requirement. 2. Security: real property mortgages, general security agreement, cross guarantees between RFF and subsidiaries. 3. Total interest expense plus cost of hedges, divided by average debt drawn. 4. LVR calculated as term debt drawn plus limited guarantee of $82.5m divided by directly secured assets based on independent valuations. 5. Current hedges only. 6. Proportion hedged calculated as current hedges/term debt drawn. 7. Duration remaining as at 30 June 2020 and includes forward start hedges. 8. Pro forma to term debt facility includes acquisition of Maryborough properties $81.1m and cattle property extension $4.1m, disposal of Mooral ($96.5m) and approved increase. Term debt facility limit of $400.0m to step down to $370.0m at the earlier of the Mooral sale or November 2021.
$- $50m $100m $150m $200m $250m FY21 FY22 FY23 FY24 Facility limit Tenor expiry Debt drawn Undrawn debt (excl approved increase)
$225.0m $72.2m $37.8m
9
Macadamia orchard harvest, Bundaberg, central Queensland, August 2020.
10
Assets to develop 5,000 ha of macadamia orchards.
Bundaberg
to 86 ha of macadamia orchards and the expansion of a macadamia tree nursery. Maryborough
entitlements contracted with the intention to progressively convert to approximately 2,200 ha of macadamia orchards. First plantings are expected to commence late FY21. Rockhampton
macadamia orchards over time.
development.
11
Spectrum of investment opportunities3
various adjustments and inclusions).1 Book value of Mooral as at 30 June 2020 is $79.7m2.
initial developments (pro forma gearing inclusive of acquisitions and Mooral sale proceeds of 28.3%).
leased.
supporting long term distribution growth.
Note: 1. The sale is conditional on completion of due diligence (within 45 days but subject to possible extensions) and Foreign Investment Review Board approval. The sale is forecast to settle Dec 2020. If the Mooral sale does not proceed the Maryborough acquisitions will be funded from the approved increase to the debt facility. 2. Includes plant and equipment approximating $3.8m and water entitlements held at fair value. 3. The income and growth attributes presented in the figure above have been provided to differentiate the profile of income and growth that can be derived from different assets. They are based on RFM’s experience and observations of agricultural lease transactions and historical rates of growth. They are neither forecasts nor projections of future returns. Past performance is not a guide to future performance.
Investments across the spectrum seek to achieve distribution growth of 4% p.a.
12
FY21 distribution increase of 4%.
DPU, DPU growth, AFFO payout and adjusted NAV1
macadamia orchard developments which are expected to produce higher income when leased.
properties will take several years. To generate AFFO in the interim:
to be leased as cropping operations (primarily sugar cane), supported by a two-year cane off- take agreement.2
as cattle properties.
target.
Note: 1. Adjusted assets incorporates most recent independent property valuations, inclusive of water entitlements. Pro forma properties and sectors presented where applicable. 2. If the off-take is not provided by the vendor the purchase price of the Maryborough properties will reduce. See disclosure dated 3 August 2020.
13
Winter muster at Cobungra, Victorian high country, August 2020.
14
develop 5,000 ha of macadamia orchards.
properties.
Good FY20 financial result. Reconfiguring the portfolio to increase earnings.
FY20 financial results highlights Portfolio highlights
10.85 cents
FY20 DISTRIBUTIONS/UNIT 4% on FY19
10.9 years
WEIGHTED AVERAGE LEASE EXPIRY
18.43 cents
FY20 EARNINGS/UNIT 80%
61 properties1
ACROSS 5 SECTORS & MULTIPLE CLIMATIC ZONES
$1.94
78%
REVENUE FROM CORPORATE OR LISTED TENANTS
11.28 cents
FY21f DISTRIBUTIONS/UNIT 4% on FY20
5.2% yield
BASED ON FY21f DPU @ $2.19 CLOSE PRICE 21 AUG 20
28.3%1,2
PRO FORMA GEARING (30–35% TARGET)
23 years
EXPERIENCE OF MANAGER: RFM
Note: 1. The Mooral almond orchard sale is conditional on completion of due diligence (within 45 days but subject to possible extensions) and Foreign Investment Review Board approval. 2. Pro forma includes acquisition of Maryborough properties, cattle property extension and disposal of Mooral.
15
Irrigated wheat three months after sowing, Lynora Downs, central Queensland, August 2020.
16
12 mths ended 12 mths ended 30 June 2020 30 June 2019 $ $ Property revenue 71,978,000 66,391,000 Revenue 71,978,000 66,391,000 Other income 4,401,000 2,541,000 Property expenses (2,066,000) (1,595,000) Other expenses (5,088,000) (3,892,000) Management fees (9,955,000) (8,496,000) Finance costs (10,881,000) (9,985,000) Gain on sale of assets 3,407,000 12,000 Depreciation and impairments (2,893,000) (1,230,000) Property revaluations - Bearer plants (5,337,000) 4,254,000 Property revaluations - Investment property 14,944,000 8,352,000 Property revaluations - Intangible assets (798,000) 105,000 Change in fair value of financial assets/liabilities 510,000 (70,000) Change in fair value of derivatives (7,624,000) (18,208,000) Profit before tax 50,598,000 38,179,000 Income tax expense (1,610,000) (4,824,000) Profit after tax 48,988,000 33,355,000 Other comprehensive income 12,950,000 (277,000) Total comprehensive income 61,938,000 33,078,000 Weighted average units 336.0m units 326.2m units Earnings per unit2 18.43 cents 10.14 cents
Summarised statement of comprehensive income
(JBS) transactions (feedlot acquisitions and J&F Australia Pty Ltd (J&F) Guarantee income), cattle property acquisitions, development capital expenditure and lease indexation (including market rent review).
allocation sales.
independent investigation report (disclosed 8 and 27 August 2019) and associated costs, and increased insurance costs.
expenditure.
water entitlement.
within RF Active.
intangibles and other comprehensive income; excluding fair value water revaluations above cost). For total assets reconciliation see page 21.
processing company Marquis Macadamias Limited.
flow through trust for tax purposes.
Notes: 1. RFM Australian Wine Fund (AWF) is a subsidiary of Rural Funds Trust (RFT) that has formed its own tax consolidated group. 2. Calculated TCI/weighted average units.
17
12 mths ended 12 mths ended 30 June 2020 31 June 2019 $ $ Property revenue 69,957,000 65,086,000 Property expenses (2,066,000) (1,595,000) Net property income 67,891,000 63,491,000 Other income 4,401,000 2,541,000 Other expenses (5,088,000) (3,892,000) Management fees (9,955,000) (8,496,000) EBITDA 57,249,000 53,644,000 Income tax payable (RF Active) (941,000) (413,000) Finance costs (10,881,000) (9,985,000) AFFO 45,427,000 43,246,000 AFFO per unit1 13.5 cents 13.3 cents DPU 10.85 cents 10.43 cents
Composition of AFFO (pre-tax)
to represent RFF’s property rental business.
insurance, rates on unleased properties, applicable cost recovery). Other expenses relate to non-property overheads (e.g. ASX, bank, audit, registry fees, cost recovery).
Note: 1. Based on the weighted average number of units on issue during the year.
18
12 mths ended 12 mths ended 30 June 2020 30 June 2019 $ $ Net profit after income tax 48,988,000 33,355,000 Adjusted for: Property revaluations (13,647,000) (17,311,000) Change in fair value of interest rate swaps 7,624,000 18,208,000 Depreciation and impairment 2,893,000 1,230,000 Depreciation - Bearer Plants 4,838,000 4,600,000 Change in fair value of financial assets/liabilities (510,000) 70,000 Gain on sale of assets (2,811,000) (12,000) Straight-lining of rental income (1,232,000) (953,000) Interest component of JBS feedlot finance lease (789,000) (352,000) Loss on disposal - one off transaction costs (596,000)
44,758,000 38,835,000 Adjusted for income tax expense 669,000 4,411,000 AFFO 45,427,000 43,246,000 AFFO per unit1 13.5 cents 13.3 cents
Reconciliation of net profit after tax to AFFO
$2.5m in almonds properties, ($0.5m) in cotton properties and ($1.3m) in poultry properties.
equipment owned within RF Active.
unencumbered ground water entitlement.
lifetime of the lease (under AASB16 for leases with fixed indexation).
indexation due to finance lease classification.
with the poultry asset sale.
Notes: 1. Based on the weighted average number of units on issue during the year.
19
Summarised balance sheet
As at As at 30 June 2020 30 Jun 2019 $ $ Cash 5,085,000 2,588,000 Property investments 892,064,000 849,033,000 Plant and equipment 6,969,000 8,537,000 Other assets 10,802,000 8,929,000 Total assets 914,920,000 869,087,000 Interest bearing liabilities:
3,814,000 3,832,000
297,248,000 291,445,000 Derivative financial liabilities 31,665,000 24,041,000 Current tax liabilities 1,533,000 439,000 Deferred tax liabilities 5,855,000 5,778,000 Other liabilities 16,839,000 17,680,000 Total liabilities 356,954,000 343,215,000 Net assets 557,966,000 525,872,000 Units on issue 337,713,420 334,263,593 NAV per unit 1.65 1.57 Adjustment for water entitlements fair value per unit 0.29 0.23 Adjusted NAV per unit 1.94 1.80
the lower of cost or fair value in accordance with accounting standards and ASIC guidance. The adjustment for water entitlements shows the difference between book value and fair value (based on current independent valuations).
entitlements total 21,430 ML, representing a fair value of $226.9m
20
Total assets reconciliation
Investment property Bearer plants Intangible assets1, 3 Financial assets – property2, 3 Other assets Total Adjustment for water entitlements at fair value1, 3 Adjusted total assets $ $ $ $ $ $ $ $ Balance as at 30 June 2019 489,327,000 172,915,000 118,531,000 68,260,000 20,054,000 869,087,000 76,769,000 945,856,000 Additions – Cattle 42,461,000
2,081,000
Additions – Cotton 2,170,000
Additions – Almond orchard 7,911,000 2,897,000 758,000 (758,000)
Additions – Macadamias 6,233,000 100,000 432,000
Additions – Vineyards 519,000
Disposals (69,846,000)
(6,608,000) (80,175,000) Depreciation and impairments
(2,893,000)
Fair value adjustment4 16,194,000 7,614,000 (798,000)
27,538,000 50,548,000 Fair value adjustment - discontinued operations (1,250,000)
JBS Feedlots
Other movements
5,695,000 7,857,000
Balance as at 30 June 2020 493,719,000 183,526,000 117,262,000 97,557,000 22,856,000 914,920,000 97,699,000 1,012,619,000
Notes: 1. Accounting standards and ASIC guidance require water entitlements to be recorded as intangible assets, and held at the lower of cost or fair value. The adjustment for water entitlements shows the adjustment to the fair value of the water entitlements held. 2. Relates to water entitlements held as part of the investment in Barossa Infrastructure Limited, Coleambally Irrigation Co-operative Limited, breeder herd finance lease, loan to Camm, loan to Katena, straight-lined asset, equipment finance leases and finance lease with JBS Australia for five feedlots, which are accounted for as financial assets. 3. Water entitlements of 122,057 ML and 21,430 ML of water delivery entitlements held by the Group representing a fair value of $226.9m. 4. Fair value adjustments as part of valuations for the year ended 30 Jun 2020.
21
Independent valuations at least every two years. Rotation of valuers every three years.
22
Note: 1. The Mooral almond orchard sale is conditional on completion of due diligence (within 45 days but subject to possible extensions) and Foreign Investment Review Board approval. Includes plant and equipment approximating $3.8m.
Diversification of 61 properties, five agricultural sectors and multiple climatic zones.1
Note: 1. Shaded areas denote climatic zones differentiated by rainfall seasonality. Source: Bureau of Meteorology; see RFF Climatic Diversification discussion paper, 20 Jun 2016. Blue square boxes on map denote cattle feedlots. Number of properties and forecast FY21 rent includes Maryborough properties (expected to settle Oct 2020, shown as cropping until converted to macadamias), and disposal of Mooral (expected to settle Dec 2020). The Mooral almond orchard sale is conditional on completion of due diligence (within 45 days but subject to possible extensions) and Foreign Investment Review Board approval. Murrumbidgee High Security water entitlement (8,754 ML) with a value of $65.2m not shown. FY20 values and FY21 rent excludes plant and equipment. Numbers in the icons show number of assets in that area.
23
Diversification by agricultural sector, lessee type and indexation mechanism.1
Agricultural sectors
Notes: 1. Figures shown are subject to rounding. Forecast includes the disposal of Mooral (expected to settle Dec 2020). The Mooral almond orchard sale is conditional on completion of due diligence (within 45 days but subject to possible extensions) and Foreign Investment Review Board approval. 2. Lessees shown by FY21f revenue. Olam refers to Olam Orchards Australia Pty Ltd, a wholly owned subsidiary of SGX-listed Olam International Ltd (SGX: O32). Income from J&F Australia Pty Ltd attributed to JBS Australia. Cotton JV income split 50% RFM and 50% listed and corporate (Queensland Cotton Corporation Pty Ltd). Excludes non-lessee income e.g. annual water allocation sales, and properties where a lessee is currently being sought.
Lessees and counterparts by type2 Indexation and mechanisms 24
RFM has policies and procedures which address ESG issues.
Tahen project
Environment Social Governance
Climate change
strategy.
emissions and seek to implement infrastructure and practice changes. RFM considers climate change may present risks primarily in the form of residual risk of the assets at the end of the lease
mitigated by how assets are
consider these types of factors as well as other risks when determining the valuations of the assets. Management of natural resources
use appropriate agricultural production methods, including minimising environmental impact, protecting biodiversity, management of water and soil health. Employment
RFF, has implemented a range
including code of conduct, HSE (health, safety and environment), incident management, diversity and equal opportunity. RFM has also implanted an extensive HSE management system to educate employees and
receives a monthly HSE report. Animal welfare
procedures in place that are explicit about animal health and welfare. Community engagement
three years to assist farmers in Tahen, Cambodia with agricultural practices to improve farm productivity (see adjacent). Compliance committee
compliance committee consisting of representatives of different business units reporting to the RFM Board of Directors. Conflicts of interest and related party transactions
interest of the unitholders
Interest Management
responsibilities are set out in RFF’s Constitution, the Corporations Act, ASX Listing Rules and Australian Financial Services Licence.
monthly report covering compliance, any conflicts of interest and related party transactions.
One of the key objectives of the project is to increase rice production (image left) by improving farming
In May 2019 Rural Funds Management committed to providing resources and agricultural expertise to improve the economic and social prospects of the village of Tahen, located in the Battambang prefecture of western Cambodia. The aim of the Tahen project is to educate and mentor local farmers to develop more modern, sustainable and diversified agricultural enterprises. RFM (not RFF) has committed to providing $1m over three years, as well as ongoing advice and support to achieve this aim. To view a video update of the Tahen project and see how RFM is “Managing Good Assets with Good People” visit: www.ruralfunds.com.au/mgawgp/.
25
Portfolio WALE of 10.9 years
Lease expiry profile1
Note: 1. Calculated as the FY21 forecast rent and the year of lease expiry. Excludes properties not leased.
26
0.0 2.0 4.0 6.0 8.0 10.0 12.0 14.0 16.0 18.0 2021 2022 2023 2024 2025 2026 2027 2028 2029 2030 2031 2032 2033 2034 2035 2036 2037 2038 Vineyards Almonds Cattle Macadamias Cropping
FY21 revenue ($m) Year of lease expiry
Developments to occur on 44 properties.1
Note: 1. Five year developments refer to development potential of assets. Pasture improvement refers to stylo on RFF’s north Qld properties, and intensive pastures including Leucaena on central Qld properties. Cultivation area refers to development of additional areas for planting forage crops such as oats. Development of grazing area for southern properties involves investments such as fertiliser to improve production of the existing area.
27
Forecast capex of $29.0m will attract rent as it is deployed.
Capital expenditure profile1
Note: 1. Figures shown are subject to rounding. Forecast capex which does not currently add to rental base is not shown. Includes forecast figures for identified development opportunities which are yet to be finalised with lessees.
FY20 ($m) FY21f ($m) FY22f ($m) Total forecast ($m) Description Almonds 10.8 5.7 0.0 5.7
FY21 capex for remaining Kerarbury water delivery infrastructure.
Cattle 3.9 10.8 0.5 11.3
Productivity developments and infrastructure.
Cropping 2.2 10.0 0.0 10.0
Productivity developments and infrastructure.
Vineyards 0.5 0.9 0.9 1.8
Vineyard redevelopment.
Macadamias 1.3 0.2 0.0 0.2
Orchard infrastructure.
Total ($m) 18.7 27.6 1.4 29.0
28
Strategy to invest across the full range of the asset continuum, whilst ensuring the asset mix continues to fund distributions (Explanatory Memorandum, October 2013).
Spectrum of investment opportunities1
Note: 1. The income and growth figures presented in the figure above have been provided to differentiate the profile of income and growth that can be derived from different assets. They are based on RFM’s experience and observations of agricultural lease transactions and historical rates of growth. They are neither forecasts nor projections of future returns. Past performance is not a guide to future performance. See RFM Newsletters dated Apr 2014 and May 2016 for further information.
Higher lease rate compensates for low or negative asset
Higher IRR through productivity improvement opportunities. AFFO accretion over lease term.
29
RFM is a fund and farm manager with 23 years experience in Australian agriculture.
30 Key information
Guy Paynter Non – Executive Chairman 10 years David Bryant Managing Director 23 years Michael Carroll Non – Executive Director 10 years James Powell General Manager – Investor Relations and Marketing 12 years Tim Sheridan Chief Operating Officer 12 years Daniel Yap Chief Financial Officer 8 years Julian Widdup Non – Executive Director 3 years Dan Edwards National Manager – Rural Funds Group 15 years
Information Details Established 1997 Assets under management $1.3 billion Ownership Directors and staff Farm and operations staff 65 Funds management staff 49 RFM direct operational experience Cropping: since 1998 Vineyards: since 2000 Poultry: 2003 to 2019 Almonds: since 2006 Macadamias: since 2006 Livestock: since 2010 RFF fee structure 1.05% p.a. adjusted total assets & cost recovery RFM key responsibilities
requirements of leases.
approvals and engagement with government.
development capital expenditure.
Emma Spear Company Secretary 11 years
RFM Board and RFF corporate management (including tenure)
Peter Wong Finance Manager 3 years Scott Roxburgh Business Manager 10 years David Thomson Senior Business Manager 13 years
Rural Funds Management Limited
ACN 077 492 838 AFSL 226701 Level 2, 2 King Street, Deakin, ACT, 2600 T: +61 2 6203 9700 F: 1800 625 518 W: ruralfunds.com.au
David Bryant Managing Director T 02 6203 9700 E DBryant@ruralfunds.com.au
For further information:
Tim Sheridan Chief Operating Officer T 02 6203 9700 E TSheridan@ruralfunds.com.au James Powell General Manager – Investor Relations & Marketing T 0420 279 374 E JPowell@ruralfunds.com.au
Learn how RFM manages good assets with good people: Follow us:
David Bryant Dan Edwards Matt Mitchell Scott Norval James Powell Scott Roxburgh Tim Sheridan Kristina Smith Emma Spear David Thomson Daryl Winter Daniel Yap
Managed by:
Rural Funds Management Limited
ACN 077 492 838 AFSL 226701 Level 2, 2 King Street, Deakin, ACT, 2600 T 02 6203 9700 F 1800 625 518 E management@ruralfunds.com.au David Bryant Managing Director T 02 6203 9700 E DBryant@ruralfunds.com.au Tim Sheridan Chief Operating Officer T 02 6203 9700 E TSheridan@ruralfunds.com.au James Powell General Manager – Investor Relations & Marketing T 0420 279 374 E JPowell@ruralfunds.com.au
See how RFM is managing good assets with good people: Follow us:
www.ruralfunds.com.au
For further information:
RFM corporate and farm management (listed alphabetically by surname)