
SLIDE 1
The 4th International Conference on “ Sustainable Solid Waste Management” Limassol, 2016
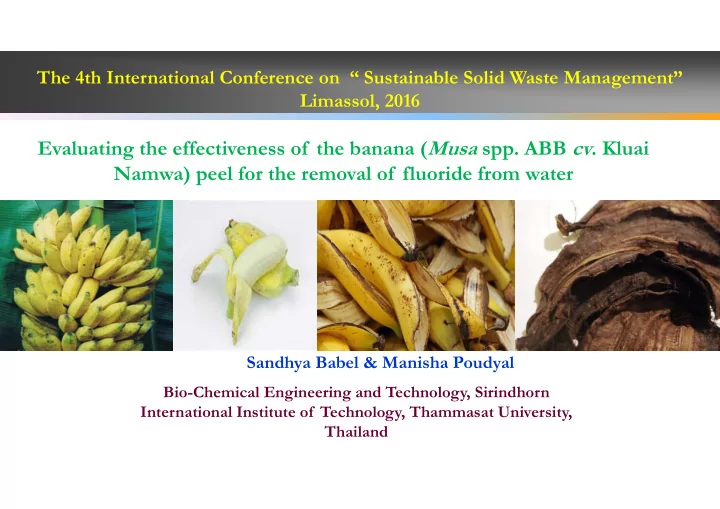
Evaluating the effectiveness of the banana (Musa spp. ABB cv. Kluai Namwa) peel for the removal of fluoride from water
Sandhya Babel & Manisha Poudyal
Bio-Chemical Engineering and Technology, Sirindhorn International Institute of Technology, Thammasat University, Thailand