
SLIDE 1
- 1-
Presentation 1: R
Murray Logan
July 15, 2017
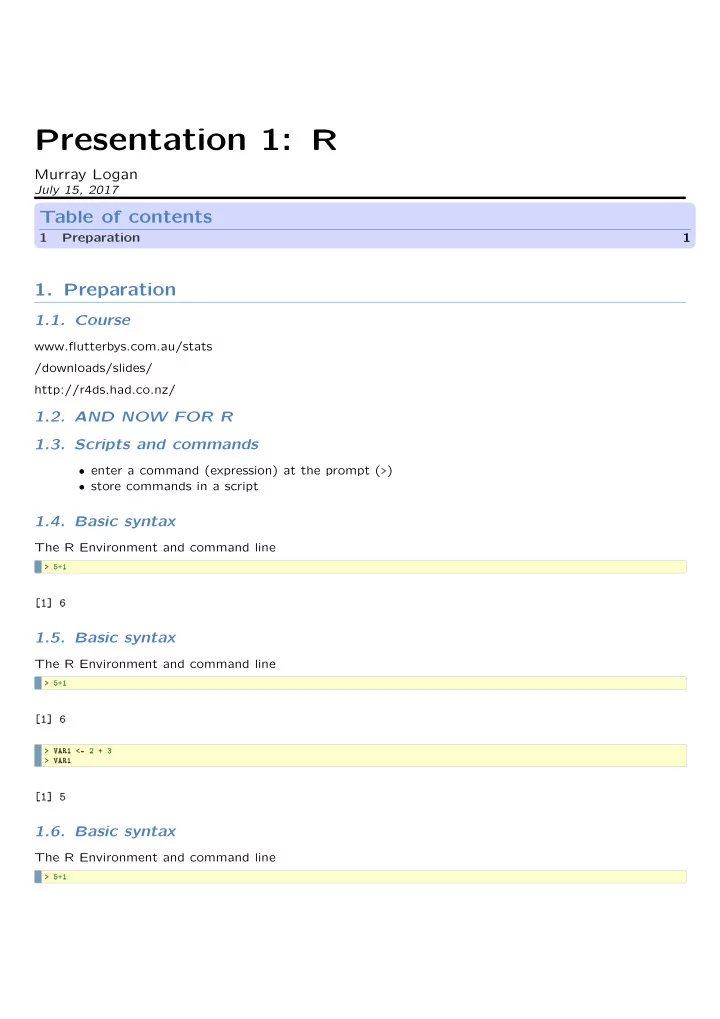
Table of contents
1 Preparation 1
- 1. Preparation
1.1. Course
www.flutterbys.com.au/stats /downloads/slides/ http://r4ds.had.co.nz/
1.2. AND NOW FOR R 1.3. Scripts and commands
- enter a command (expression) at the prompt (>)
- store commands in a script
1.4. Basic syntax
The R Environment and command line
> 5+1
[1] 6
1.5. Basic syntax
The R Environment and command line
> 5+1
[1] 6
> VAR1 <- 2 + 3 > VAR1
[1] 5
1.6. Basic syntax
The R Environment and command line
> 5+1