Present and Future Present and Future Supercomputer Architectures - - PDF document

present and future present and future supercomputer
SMART_READER_LITE
LIVE PREVIEW

Present and Future Present and Future Supercomputer Architectures - - PDF document

Hong Kong, China, 13-15 Dec. 2004 Present and Future Present and Future Supercomputer Architectures Supercomputer Architectures Jack Dongarra University of Tennessee and Oak Ridge National Laboratory 12/12/2004 1 A Growth- A Growth


slide-1
SLIDE 1

1

12/12/2004 1

Present and Future Present and Future Supercomputer Architectures Supercomputer Architectures

Jack Dongarra University of Tennessee and Oak Ridge National Laboratory

Hong Kong, China, 13-15 Dec. 2004

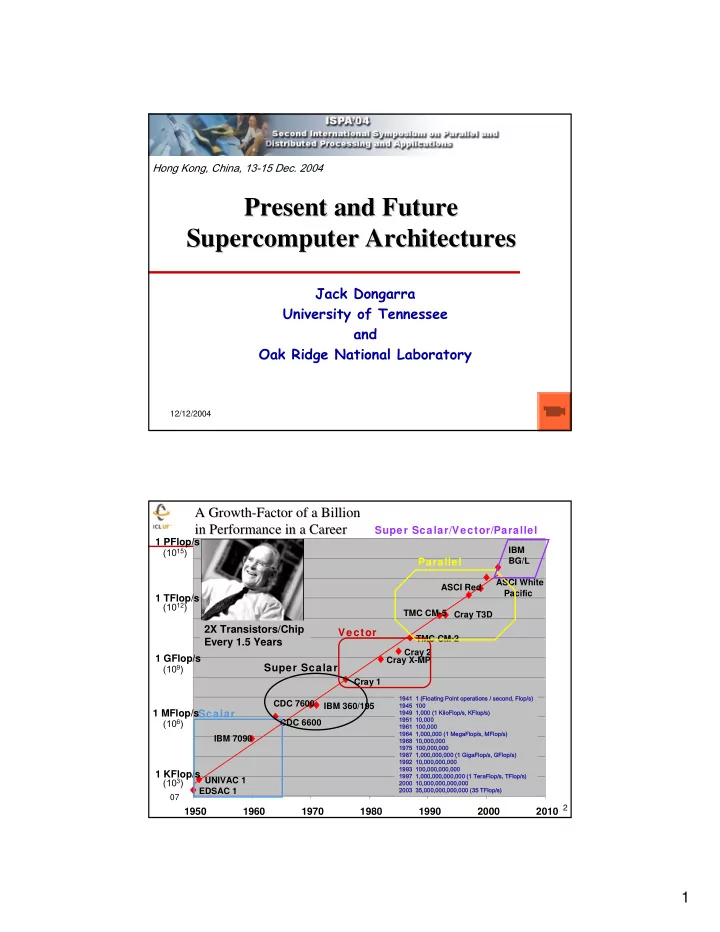
07 2 IBM BG/L ASCI White Pacific EDSAC 1 UNIVAC 1 IBM 7090 CDC 6600 IBM 360/195 CDC 7600 Cray 1 Cray X-MP Cray 2 TMC CM-2 TMC CM-5 Cray T3D ASCI Red

1950 1960 1970 1980 1990 2000 2010 1 KFlop/s 1 MFlop/s 1 GFlop/s 1 TFlop/s 1 PFlop/s Scalar Super Scalar Vector Parallel Super Scalar/Vector/Parallel

1941 1 (Floating Point operations / second, Flop/s) 1945 100 1949 1,000 (1 KiloFlop/s, KFlop/s) 1951 10,000 1961 100,000 1964 1,000,000 (1 MegaFlop/s, MFlop/s) 1968 10,000,000 1975 100,000,000 1987 1,000,000,000 (1 GigaFlop/s, GFlop/s) 1992 10,000,000,000 1993 100,000,000,000 1997 1,000,000,000,000 (1 TeraFlop/s, TFlop/s) 2000 10,000,000,000,000 2003 35,000,000,000,000 (35 TFlop/s)

(103) (106) (109) (1012) (1015)

2X Transistors/Chip Every 1.5 Years

A Growth A Growth-

  • Factor of a Billion

Factor of a Billion in Performance in a Career in Performance in a Career

slide-2
SLIDE 2

2

07 3

  • H. Meuer, H. Simon, E. Strohmaier, & JD
  • H. Meuer, H. Simon, E. Strohmaier, & JD
  • Listing of the 500 most powerful

Computers in the World

  • Yardstick: Rmax from LINPACK MPP

Ax=b, dense problem

  • Updated twice a year

SC‘xy in the States in November Meeting in Mannheim, Germany in June

  • All data available from www.top500.org

Size Rate

TPP performance

07 4

♦ A supercomputer is a

hardware and software system that provides close to the maximum performance that can currently be achieved.

♦ Over the last 10 years the

range for the Top500 has increased greater than Moore’s Law

♦ 1993: #1 = 59.7 GFlop/s #500 = 422 MFlop/s ♦ 2004: #1 = 70 TFlop/s #500 = 850 GFlop/s

What is a What is a Supercomputer? Supercomputer?

Why do we need them? Almost all of the technical areas that are important to the well-being of humanity use supercomputing in fundamental and essential ways. Computational fluid dynamics, protein folding, climate modeling, national security, in particular for cryptanalysis and for simulating nuclear weapons to name a few.

slide-3
SLIDE 3

3

07 5

  • 1. 127 PF/ s
  • 1. 167 TF/ s
  • 59. 7 GF/ s
  • 70. 72 TF/ s
  • 0. 4 GF/ s

850 GF/ s

1993 1994 1995 1996 1997 1998 1999 2000 2001 2002 2003 2004

Fuj itsu 'NWT' NAL NEC Earth Simulat or Intel ASCI Red Sandia IBM ASCI White LLNL

N=1 N=500 SUM

1 Gf lop/ s

1 Tflop/ s 100 Mflop/ s 100 Gflop/ s 100 Tflop/ s 10 Gflop/ s 10 Tflop/ s 1 Pflop/ s

IBM BlueGene/ L

My Laptop

TOP500 Performance TOP500 Performance – – November 2004 November 2004

07 6

Vibrant Field for High Performance Vibrant Field for High Performance Computers Computers

♦ Cray X1 ♦ SGI Altix ♦ IBM Regatta ♦ IBM Blue Gene/L ♦ IBM eServer ♦ Sun ♦ HP ♦ Dawning ♦ Bull NovaScale ♦ Lanovo ♦ Fujitsu PrimePower ♦ Hitachi SR11000 ♦ NEC SX-7 ♦ Apple

♦ Coming soon …

Cray RedStorm Cray BlackWidow NEC SX-8 Galactic Computing

slide-4
SLIDE 4

4

07 7

Architecture/Systems Continuum Architecture/Systems Continuum

Custom processor with custom interconnect

  • Cray X1
  • NEC SX-7
  • IBM Regatta
  • IBM Blue Gene/L

Commodity processor with custom interconnect

  • SGI Altix

Intel Itanium 2

  • Cray Red Storm

AMD Opteron

Commodity processor with commodity interconnect

  • Clusters

Pentium, Itanium, Opteron, Alpha GigE, Infiniband, Myrinet, Quadrics

  • NEC TX7
  • IBM eServer
  • Dawning

Loosely Coupled Tightly Coupled

Best processor performance for codes that are not “cache friendly”

Good communication performance

Simplest programming model

Most expensive

Good communication performance

Good scalability

Best price/performance (for codes that work well with caches and are latency tolerant)

More complex programming model

0% 20% 40% 60% 80% 100% J u n -9 3 D e c -9 3 J u n -9 4 D e c -9 4 J u n -9 5 D e c -9 5 J u n -9 6 D e c -9 6 J u n -9 7 D e c -9 7 J u n -9 8 D e c -9 8 J u n -9 9 D e c -9 9 J u n -0 0 D e c -0 0 J u n -0 1 D e c -0 1 J u n -0 2 D e c -0 2 J u n -0 3 D e c -0 3 J u n -0 4

Custom Commod Hybrid

07 8

Top500 Performance by Manufacture (11/04)

IBM 49% HP 21%

  • thers

14% SGI 7% NEC 4% Fujitsu 2% Cray 2% Hitachi 1% Sun 0% Intel 0%

slide-5
SLIDE 5

5

07 9

Commodity Processors Commodity Processors

♦ Intel Pentium Nocona

3.6 GHz, peak = 7.2 Gflop/s Linpack 100 = 1.8 Gflop/s Linpack 1000 = 3.1 Gflop/s

♦ AMD Opteron

2.2 GHz, peak = 4.4 Gflop/s Linpack 100 = 1.3 Gflop/s Linpack 1000 = 3.1 Gflop/s

♦ Intel Itanium 2

1.5 GHz, peak = 6 Gflop/s Linpack 100 = 1.7 Gflop/s Linpack 1000 = 5.4 Gflop/s

♦ HP PA RISC ♦ Sun UltraSPARC IV ♦ HP Alpha EV68

1.25 GHz, 2.5 Gflop/s peak

♦ MIPS R16000

07 10

♦ Gig Ethernet ♦ Myrinet ♦ Infiniband ♦ QsNet ♦ SCI

Clos F a t t r e e T

  • r

u s

Commodity Interconnects Commodity Interconnects

Cost Cost Cost MPI Lat / 1-way / Bi-Dir Switch topology NIC Sw/node Node (us) / MB/s / MB/s Gigabit Ethernet Bus $ 50 $ 50 $ 100 30 / 100 / 150 SCI Torus $1,600 $ 0 $1,600 5 / 300 / 400 QsNetII (R) Fat Tree $1,200 $1,700 $2,900 3 / 880 / 900 QsNetII (E) Fat Tree $1,000 $ 700 $1,700 3 / 880 / 900 Myrinet (D card) Clos $ 595 $ 400 $ 995 6.5 / 240 / 480 Myrinet (E card) Clos $ 995 $ 400 $1,395 6 / 450 / 900 IB 4x Fat Tree $1,000 $ 400 $1,400 6 / 820 / 790

slide-6
SLIDE 6

6

07 11

24th List: The TOP10 24th List: The TOP10

2500 2003 USA NCSA 9.82 Tungsten

PowerEdge, Myrinet

Dell 10 2944 2004 USA Naval Oceanographic Office 10.31 pSeries 655 IBM 9 8192 2004 USA Lawrence Livermore National Laboratory 11.68 BlueGene/L

DD1 500 MHz

IBM/LLNL 8 2200 2004 USA Virginia Tech 12.25 X

Apple XServe, Infiniband

Self Made 7 8192 2002 USA Los Alamos National Laboratory 13.88 ASCI Q

AlphaServer SC, Quadrics

HP 6 4096 2004 USA Lawrence Livermore National Laboratory 19.94 Thunder

Itanium2, Quadrics

CCD 5 3564 2004 Spain Barcelona Supercomputer Center 20.53 MareNostrum

BladeCenter JS20, Myrinet

IBM 4 5120 2002 Japan Earth Simulator Center 35.86 Earth-Simulator NEC 3 10160 2004 USA NASA Ames 51.87 Columbia

Altix, Infiniband

SGI 2 32768 2004 USA DOE/IBM 70.72 BlueGene/L

β-System

IBM 1 #Proc Year Country Installation Site Rmax

[TF/s]

Computer Manufacturer 399 system > 1 TFlop/s; 294 machines are clusters, top10 average 8K proc 07 12 Chip (2 processors) Compute Card (2 chips, 2x1x1) 4 processors Node Card (32 chips, 4x4x2) 16 Compute Cards 64 processors System (64 racks, 64x32x32) 131,072 procs Rack (32 Node boards, 8x8x16) 2048 processors 2.8/5.6 GF/s 4 MB (cache) 5.6/11.2 GF/s 1 GB DDR 90/180 GF/s 16 GB DDR 2.9/5.7 TF/s 0.5 TB DDR 180/360 TF/s 32 TB DDR

IBM IBM BlueGene BlueGene/L /L

131,072 Processors 131,072 Processors

“Fastest Computer” BG/L 700 MHz 32K proc 16 racks Peak: 91.7 Tflop/s Linpack: 70.7 Tflop/s

77% of peak BlueGene/L Compute ASIC

Full system total of 131,072 processors

slide-7
SLIDE 7

7

07 13

BlueGene/L Interconnection Networks BlueGene/L Interconnection Networks

3 Dimensional Torus

  • Interconnects all compute nodes (65,536)
  • Virtual cut-through hardware routing
  • 1.4Gb/s on all 12 node links (2.1 GB/s per node)
  • 1 µs latency between nearest neighbors, 5 µs to the

farthest

  • 4 µs latency for one hop with MPI, 10 µs to the

farthest

  • Communications backbone for computations
  • 0.7/1.4 TB/s bisection bandwidth, 68TB/s total

bandwidth Global Tree

  • Interconnects all compute and I/O nodes (1024)
  • One-to-all broadcast functionality
  • Reduction operations functionality
  • 2.8 Gb/s of bandwidth per link
  • Latency of one way tree traversal 2.5 µs
  • ~23TB/s total binary tree bandwidth (64k machine)

Ethernet

  • Incorporated into every node ASIC
  • Active in the I/O nodes (1:64)
  • All external comm. (file I/O, control, user

interaction, etc.) Low Latency Global Barrier and Interrupt

  • Latency of round trip 1.3 µs

Control Network 07 14

NASA Ames: SGI NASA Ames: SGI Altix Altix Columbia Columbia 10,240 Processor System 10,240 Processor System

♦ Architecture: Hybrid Technical Server Cluster ♦ Vendor: SGI based on Altix systems ♦ Deployment: Today ♦ Node: 1.5 GHz Itanium-2 Processor 512 procs/node (20 cabinets) Dual FPU’s / processor ♦ System: 20 Altix NUMA systems @ 512 procs/node = 10240 procs 320 cabinets (estimate 16 per node) Peak: 61.4 Tflop/s ; LINPACK: 52 Tflop/s ♦ Interconnect: FastNumaFlex (custom hypercube) within node

Infiniband between nodes

♦ Pluses: Large and powerful DSM nodes ♦ Potential problems (Gotchas): Power consumption - 100 kw per node (2 Mw total)

slide-8
SLIDE 8

8

07 15

Performance Projection Performance Projection

1 9 9 3 1 9 9 5 1 9 9 7 1 9 9 9 2 0 0 1 2 0 0 3 2 0 0 5 2 0 0 7 2 0 0 9 2 0 1 1 2 0 1 3 2 0 1 5

N=1 N=500 SUM

1 Gflop/s 1 Tflop/s 100 Mflop/s 100 Gflop/s 100 Tflop/s 10 Gflop/s 10 Tflop/s 1 Pflop/s 10 Pflop/s 1 Eflop/s 100 Pflop/s

DARPA HPCS BlueGene/ L My Laptop

07 16

Power: Watts/ Power: Watts/Gflop Gflop (smaller is better)

(smaller is better)

20 40 60 80 100 120

B l u e G e n e / L D D 2 b e t a

  • S

y s t e m ( . 7 G H z P

  • w

e r P C 4 4 ) S G I A l t i x 1 . 5 G H z , V

  • l

t a i r e I n f i n i b a n d E a r t h

  • S

i m u l a t

  • r

e S e r v e r B l a d e C e n t e r J S 2 + ( P

  • w

e r P C 9 7 2 . 2 G H z ) , M y r i n e t I n t e l I t a n i u m 2 T i g e r 4 1 . 4 G H z

  • Q

u a d r i c s A S C I Q

  • A

l p h a S e r v e r S C 4 5 , 1 . 2 5 G H z 1 1 D u a l 2 . 3 G H z A p p l e X S e r v e / M e l l a n

  • x

I n f i n i b a n d 4 X / C i s c

  • G

i g E B l u e G e n e / L D D 1 P r

  • t
  • t

y p e ( . 5 G H z P

  • w

e r P C 4 4 w / C u s t

  • m

) e S e r v e r p S e r i e s 6 5 5 ( 1 . 7 G H z P

  • w

e r 4 + ) P

  • w

e r E d g e 1 7 5 , P 4 X e

  • n

3 . 6 G H z , M y r i n e t e S e r v e r p S e r i e s 6 9 ( 1 . 9 G H z P

  • w

e r 4 + ) e S e r v e r p S e r i e s 6 9 ( 1 . 9 G H z P

  • w

e r 4 + ) L N X C l u s t e r , X e

  • n

3 . 4 G H z , M y r i n e t R I K E N S u p e r C

  • m

b i n e d C l u s t e r B l u e G e n e / L D D 2 P r

  • t
  • t

y p e ( . 7 G H z P

  • w

e r P C 4 4 ) I n t e g r i t y r x 2 6 I t a n i u m 2 1 . 5 G H z , Q u a d r i c s D a w n i n g 4 A , O p t e r

  • n

2 . 2 G H z , M y r i n e t O p t e r

  • n

2 G H z , M y r i n e t M C R L i n u x C l u s t e r X e

  • n

2 . 4 G H z

  • Q

u a d r i c s A S C I W h i t e , S P P

  • w

e r 3 3 7 5 M H z

Watts/Gflop

Top 20 systems Based on processor power rating only

slide-9
SLIDE 9

9

07 17

Top500 in Asia Top500 in Asia (Numbers of Machines)

(Numbers of Machines)

Japan China South Korea India Others 20 40 60 80 100 120 6 / 1 9 9 3 6 / 1 9 9 4 6 / 1 9 9 5 6 / 1 9 9 6 6 / 1 9 9 7 6 / 1 9 9 8 6 / 1 9 9 9 6 / 2 6 / 2 1 6 / 2 2 6 / 2 3 6 / 2 4

07 18

416 851 2004 Industry SuperDome 875 MHz/HyperPlex HP Digital China Ltd. 498 238 873 2004 Industry HP BL-20P, Pentium4 Xeon 3.06 GHz HP China Petroleum 482 256 877 2003 Academic DeepSuper-21C, P4 Xeon 3.06/2.8 GHz, Myrinet Tsinghua U Shenzhen University 481 192 971 2004 Industry Integrity Superdome, 1.5 GHz, HPlex HP Saxony Developments Ltd 419 512 1013 2004 Industry SuperDome 875 MHz/HyperPlex HP Huapu Information Technology 384 256 1016 2004 Academic DL360G3, Pentium4 Xeon 3.2 GHz, Myrinet HP Fudan University 372 448 1040 2003 Industry BladeCenter Cluster Xeon 2.4 GHz, Gig- Ethernet IBM XinJiang Oil 355 1008 1107 2004 Research eServer pSeries 655 (1.7 GHz Power4+) IBM China Meteorological Administration 324 622 1256 2003 Governmn’t xSeries Cluster Xeon 2.4 GHz - Gig-E IBM Public Sector 247 560 1281 2004 Industry SuperDome 1 GHz/HPlex HP Digital China Ltd. 229 512 1297 2002 Academic DeepComp 1800 - P4 Xeon 2 GHz - Myrinet lenovo Academy of Mathematics and System Science 225 348 1401 2004 Academic DL360G3 Xeon 3.06 GHz, Infiniband HP University of Shanghai 209 412 1547 2004 Industry BladeCenter Xeon 3.06 GHz, Gig-Ethernet IBM Geoscience (A) 184 512 1923 2004 Industry BladeCenter Xeon 3.06 GHz, Gig-Ethernet IBM Petroleum Company (D) 132 768 3231 2004 Academic xSeries Xeon 3.06 GHz, Myrinet IBM Institute of Scientific Computing/Nankai University 61 1024 4193 2003 Academic DeepComp 6800, Itanium2 1.3 GHz, QsNet lenovo Chinese Academy of Science 38 2560 8061 2004 Research Dawning 4000A, Opteron 2.2 GHz, Myrinet Dawning Shanghai Supercomputer Center 17 Procs R max Year Area Computer Manufacturer Installation-site-name

Rank

17 Chinese Sites on the Top500 17 Chinese Sites on the Top500

Total performance growing by a factor of 3 every 6 months for the past 24 months

slide-10
SLIDE 10

10

07 19

Important Metrics: Important Metrics: Sustained Performance and Cost Sustained Performance and Cost

♦ Commodity processors Optimized for commercial applications. Meet the needs of most of the scientific computing market. Provide the shortest time-to-solution and the highest sustained performance per unit cost for a broad range of applications that have significant spatial and temporal locality (good caches use). ♦ Custom processors For bandwidth-intensive applications that do not cache well, custom processors are more cost effective Hence offering better capacity on just those applications.

07 20

High Bandwidth High Bandwidth vs vs Commodity Systems Commodity Systems

♦ High bandwidth systems have traditionally been vector

computers

Designed for scientific problems Capability computing ♦ Commodity processors are designed for web servers and the

home PC market

(should be thankful that the manufactures keep the 64 bit fl pt) Used for cluster based computers leveraging price point ♦ Scientific computing needs are different Require a better balance between data movement and floating point operations. Results in greater efficiency.

Eart rth Si h Simulator Cray ray X1 X1 ASCI Q Q MCR Apple X e Xserv erve (NEC) (Cr Cray) (HP E EV68) Xeo eon IB IBM P PowerPC Year Year o

  • f I

Introduction 2002 2003 2002 2002 20 2003 03 Node A Archi chitecture re Vect ctor

  • r

Vect ctor

  • r

Alph pha Pent ntium Po Power PC r PC Processor C Cycle T Time 50 500 MH 0 MHz 800 00 MH MHz 1.25 G 5 GHz 2.4 GH GHz 2 GH 2 GHz Peak Spe Speed pe d per P Proce

  • cessor

8 G Gflop/s 12.8 G Gflop/ p/s 2.5 G Gflop/

  • p/s

4.8 G Gflop/s 8 Gfl 8 Gflop/s Operan ands/Flop(mai main memo memory) 0.5 0.33 0.1 0.0 .055 0. 0.063

System Balance - MEMORY BANDWIDTH

slide-11
SLIDE 11

11

07 21

System Balance (Network) System Balance (Network)

Network Speed (MB/s) vs Node speed (flop/s)

2.00 1.60 1.20 1.00 0.38 0.02 0.08 0.05 0.18 0.13

0.00 0.50 1.00 1.50 2.00 2.50 Cray X1 Cray Red Storm ASCI Red Cray T3E/1200 Blue Gene/L ASCI Blue Mountain ASCI White LANL Pink PSC Lemieux ASCI Purple

Communication/Computation Balance (Bytes/Flop) (Higher is better) 07 22

SETI@home SETI@home: Global Distributed Computing : Global Distributed Computing

♦ Running on 500,000 PCs, ~1300 CPU

Years per Day

1.3M CPU Years so far

♦ Sophisticated Data & Signal

Processing Analysis

♦ Distributes Datasets from Arecibo

Radio Telescope

slide-12
SLIDE 12

12

07 23

SETI@home SETI@home

♦ Use thousands of Internet-

connected PCs to help in the search for extraterrestrial intelligence.

♦ When their computer is idle

  • r being wasted this

software will download ~ half a MB chunk of data for analysis. Performs about 3 Tflops for each client in 15 hours.

♦ The results of this analysis

are sent back to the SETI team, combined with thousands of other participants.

♦ About 5M users

♦ Largest distributed

computation project in existence

Averaging 72 Tflop/s

07 24 ♦

Google query attributes

150M queries/day (2000/second) 100 countries 8.0B documents in the index

Data centers

100,000 Linux systems in data centers around the world

15 TFlop/s and 1000 TB total capability 40-80 1U/2U servers/cabinet 100 MB Ethernet switches/cabinet with gigabit Ethernet uplink

growth from 4,000 systems (June 2000)

18M queries then

Performance and operation simple reissue of failed commands to new servers no performance debugging

  • problems are not reproducible

Source: Monika Henzinger, Google & Cleve Moler

Forward link are referred to in the rows Back links are referred to in the columns

Eigenvalue problem; Ax = λx n=8x10⁹ (see: MathWorks Cleve’s Corner)

The matrix is the transition probability matrix of the Markov chain; Ax = x

slide-13
SLIDE 13

13

07 25

The Grid The Grid

♦ The Grid is about gathering resources …

run programs, access data, provide services, collaborate

♦ …To enable and exploit large scale sharing of

resources

♦ Virtual organization

Loosely coordinated groups

♦ Provides for remote access of resources

Scalable Secure Reliable mechanisms for discovery and access

♦ In some ideal setting:

User submits work, infrastructure finds an execution target Ideally you don’t care where.

07 26

The Grid

slide-14
SLIDE 14

14

07 27

The Grid: The Grid: The Good, The Bad, and The Ugly The Good, The Bad, and The Ugly

♦ Good: Vision; Community; Developed functional software; ♦ Bad: Oversold the grid concept; Still too hard to use; Solution in search of a problem; Underestimated the technical difficulties; Not enough of a scientific discipline; ♦ Ugly: Authentication and security

07 28

The Computing Continuum The Computing Continuum

♦ Each strikes a different balance

computation/communication coupling

♦ Implications for execution efficiency ♦ Applications for diverse needs

computing is only one part of the story!

Loosely Coupled Tightly Coupled

Clusters Highly Parallel “Grids”

Special Purpose “SETI / Google”

slide-15
SLIDE 15

15

07 29

Grids vs. Capability vs. Cluster Computing Grids vs. Capability vs. Cluster Computing

♦ Not an “either/or” question

Each addresses different needs Each are part of an integrated solution

♦ Grid strengths

Coupling necessarily distributed resources

instruments, software, hardware, archives, and people

Eliminating time and space barriers

remote resource access and capacity computing

Grids are not a cheap substitute for capability HPC

♦ Highest performance computing strengths

Supporting foundational computations

terascale and petascale “nation scale” problems

Engaging tightly coupled computations and teams

♦ Clusters

Low cost, group solution Potential hidden costs

♦ Key is easy access to resources in a transparent way

07 30

Petascale Systems In 2008 Petascale Systems In 2008

♦ Technology trends multicore processors perhaps heterogeneous

IBM Power4 and SUN UltraSPARC IV Itanium “Montecito” in 2005 quad-core and beyond are coming

reduced power consumption

laptop and mobile market drivers

increased I/O and memory interconnect integration

PCI Express, Infiniband, …

♦ Let’s look forward a few years to 2008 8-way or 16-way cores (8 or 16 processors/chip) ~10 GFlop cores (processors) and 4-way nodes (4, 8-way cores/node) 12x Infiniband-like interconnect, perhaps heterogeneous

With 10 GFlop processors

100K processors and 3100 nodes (4-way with 8 cores each) 1-3 MW of power, at a minimum ♦

To some extent, Petaflops systems will look like a “Grid in a Box”

slide-16
SLIDE 16

16

07 31

How Big Is Big? How Big Is Big?

♦ Every 10X brings new challenges 64 processors was once considered large

it hasn’t been “large” for quite a while

1024 processors is today’s “medium” size 8096 processors is today’s “large”

we’re struggling even here

♦ 100K processor systems are in construction we have fundamental challenges in dealing with machines of this size … and little in the way

  • f programming support

07 32

Fault Tolerance in the Fault Tolerance in the Computation Computation

Some next generation systems are being designed with > 100K processors (IBM Blue Gene L).

MTTF 105 - 106 hours for component.

sounds like a lot until you divide by 105! Failures for such a system can be just a few hours, perhaps minutes away. ♦

Problem with the MPI standard, no recovery from faults.

Application checkpoint / restart is today’s typical fault tolerance method. ♦ Many cluster based on

commodity parts don’t have error correcting primary memory.

slide-17
SLIDE 17

17

07 33

Real Crisis With HPC Is With The Real Crisis With HPC Is With The Software Software

♦ Programming is stuck

Arguably hasn’t changed since the 60’s

♦ It’s time for a change

Complexity is rising dramatically

highly parallel and distributed systems

From 10 to 100 to 1000 to 10000 to 100000 of processors!!

multidisciplinary applications

♦ A supercomputer application and software are usually

much more long-lived than a hardware

Hardware life typically five years at most. Fortran and C are the main programming models

♦ Software is a major cost component of modern

technologies.

The tradition in HPC system procurement is to assume that the software is free.

♦ We don’t have many great ideas about how to solve

this problem.

07 34

Collaborators / Support Collaborators / Support

♦ TOP500

  • H. Meuer, Mannheim U
  • H. Meuer, Mannheim U
  • H. Simon, NERSC
  • H. Simon, NERSC
  • E. Strohmaier
  • E. Strohmaier