
SLIDE 1
1
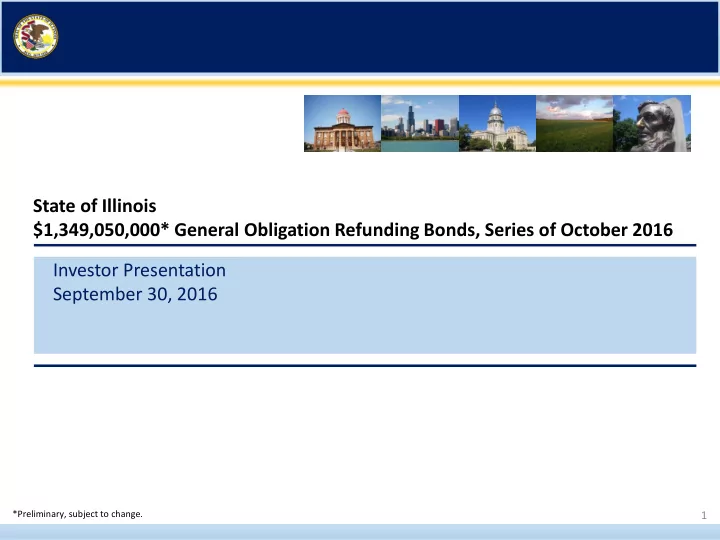
Investor Presentation September 30, 2016 State of Illinois $1,349,050,000* General Obligation Refunding Bonds, Series of October 2016
*Preliminary, subject to change.
*Preliminary, subject to change. 1 Disclaimer This investor - - PowerPoint PPT Presentation
State of Illinois $1,349,050,000* General Obligation Refunding Bonds, Series of October 2016 Investor Presentation September 30, 2016 *Preliminary, subject to change. 1 Disclaimer This investor presentation that you are about to view is
1
*Preliminary, subject to change.
2
This investor presentation that you are about to view is provided as of September 30, 2016 for a proposed offering of $1,349,050,000* General Obligation Refunding Bonds, Series of October 2016 (the “Bonds”) of the State of Illinois (the “State”). This presentation has been prepared for information purposes only and for your sole and exclusive use in connection with the proposed transaction. The information contained herein is subject to completion and amendment. Any offer or solicitation with respect to the Bonds will be made by means of a final official statement, which contains information, including without limitation risk factors, which his essential for an evaluation of an investment in the Bonds. If you are viewing this investor presentation after the date stated above, events may have occurred that have a material adverse effect on the financial information presented. This presentation does not constitute nor does it form part of an offer to sell or purchase, or the solicitation of an offer to sell or purchase, any securities or an
the issuer, underwriters or any of their affiliates to provide, issue, arrange or underwrite any financing or enter into any other transaction. You will be responsible for making your own independent investigation and appraisal of the risks, benefits, appropriateness and suitability of the proposed transaction and any other transactions contemplated by this presentation and neither the issuer nor the underwriters are making any recommendation (personal or otherwise)
Neither the issuer nor the underwriters make a representation or warranty as to the (i) accuracy, adequacy or completeness of any information in this investor presentation or (ii) legal, tax or accounting treatment of any purchase of Bonds by you or any other effects such purchase may have on you and your affiliates. The State does not undertake any obligation, or guarantee its ability to provide any additional information or to update any of the information or the conclusions contained herein or to correct any inaccuracies that may become apparent. This investor presentation contains “forward-looking” statements that involve risks, uncertainties and assumptions. If the risks or uncertainties ever materialize
caution you not to place undue reliance on these statements. All statements other than the statements of historical fact could be deemed forward-looking. All
THE PRINTING, DUPLICATING, DOWNLOADING, SCREEN CAPTURING, ELECTRONIC STORING, RECORDING, PUBLISHING OR DISTRIBUTING OF THIS INVESTOR PRESENTATION IN ANY MANNER IS STRICTLY PROHIBITED. By viewing this investor presentation you acknowledge that you understand and agree to the provisions of this page. The links to both the electronic presentation and the Preliminary Official Statement can be found below and will expire on October 13, 2016. The Preliminary Official Statement for this issue can be found at www.emma.com under CUSIP 452152
*Preliminary, subject to change.
3
State of Illinois
and Budget
Management and Budget
Financial Advisor
Legal Team
Joint Bookrunning Senior Managers
4
Tim Nuding, Director of the Governor’s Office of Management and Budget
Management and Budget in January 2015
government with focus on budget issues
Scott Harry, Chief of Staff for the Governor’s Office of Management and Budget
Management and Budget in January 2015
government with a focus on state finance, budgets, grant accountability and policy Kim Fowler, Chief Legal Counsel
Management and Budget in January 2015
serving on Governor’s legal staff from 1990-1998 and as Illinois’ debt director from 1999-2002 Alexis Sturm, Deputy Director for Debt, Capital and Revenue
in September 2015
years as senior staff for the Comptroller working on fiscal policy issues and fiscal/debt reporting and over 6 years in the Governor’s budget office working on debt management and revenue issues Kelly Hutchinson, Director of Capital Markets
program
advisory firm
years of experience in investment banking and corporate finance
5
*Preliminary, subject to change.
General Obligation Refunding Bonds, Series of October 2016
Estimated Size $1,349,050,000* Method of Sale Negotiated Use of Proceeds To refund all or a portion of certain maturities of outstanding general obligation bonds of the State Tax Status Federally Tax-Exempt; State of Illinois Taxable Final Maturity* February 1, 2033 Coupon Fixed Rate Amortization* Serial bonds amortizing from February 1, 2018 - 2033 Interest Payment Dates* February 1 and August 1, commencing February 1, 2017 Redemption Features* 10 Year Par Call Security and Repayment Source Direct general obligation of the State; full faith and credit pledge Ratings* (S&P/Fitch/Moody’s) BBB/BBB+/Baa2 Pricing Date* October 13, 2016 Closing Date* To Be Determined Senior Managers Bank of America Merrill Lynch / Jefferies
Preliminary Amortization*
Maturity (Feb 1) Par ($000) 2018 92,510 2019 97,825 2020 108,520 2021 75,650 2022 84,540 2023 71,400 2024 62,430 2025 92,300 2026 116,350 2027 140,645 2028 128,720 2029 84,170 2030 85,460 2031 51,815 2032 29,835 2033 26,880
6
Trade/Transportation/Utilities, and Professional/Business Services 2015 Non-Agricultural Payroll Jobs by Industry Unemployment Rates*
Source: U.S. Department of Labor, Bureau of Labor Statistics Source: U.S. Department of Labor, Bureau of Labor Statistics Data
20% 15% 15% 14% 10% 10% 6% 6% 4%
Trade, Transportation and Utilities Professional and Business Services Education and Health Services Government Manufacturing Leisure and Hospitality Financial Activities Mining, Logging, Information and Other Services Construction
Per Capita Income Per Capita Gross Domestic Product (GDP)
$40,000 $45,000 $50,000 $55,000 2011 2012 2013 2014 2015
Illinois United States Great Lakes Region
5% 7% 9% 11% 2011 2012 2013 2014 2015
Illinois Unemployment National Unemployment
$30,000 $35,000 $40,000 $45,000 $50,000
Illinois United States Great Lakes Region
2011 2012 2013 2014 2015 *Illinois’ unemployment rate is not seasonally adjusted. The national unemployment rate is seasonally adjusted.
Source: U.S. Department of Commerce, Bureau of Economic Analysis Source: Bureau of Economic Analysis
7
36 Fortune 500 Companies Headquartered in Illinois1 Major Illinois Universities2
1Source: Fortune Magazine, June 6, 2016. 2Source: Illinois Student Assistance Commission, 2015 Data Book, June 30, 2015.
In early 2015, the newly elected Governor reviewed the State’s Fiscal Year 2015 General Funds budget in preparation for development of the Fiscal Year 2016 Budget Proposal
budgetary deficit of $1.6 billion absent changes to the budget plan
automatic statutory reduction
nearly $2 billion in Fiscal Year 2015, and was estimated to reduce annual income tax revenues by between $4-5 billion
estimated budgetary basis deficit in the General Funds budget. These budget actions included:
funds to the General Funds
yielded nearly $400 million in reduced spending authority for State agencies
8
FY 2015 General Funds Actual Revenues FY 2015 General Funds Actual Expenditures
43% 22% 9% 8% 8% 7% 3%
Net Individual Income Taxes Sales Taxes Federal Sources Transfers in Net Corporate Income Taxes All Other Sources Public Utility Taxes
23% 20% 17% 15% 8% 7% 6% 4%
Education Healthcare Pensions Human Services Government Services Statutory Transfers Out Debt Service: Capital & Pension Bonds Public Safety
FY 2015 General Funds Actual Results ($ millions) Total Revenues: $35,888 Total Expenditures: 35,358 Interfund Borrowing/IOC Adjustments1: 501 Total Surplus: $1,031
1 In FY 2015, Illinois interfund borrowed $454 million that is not considered part of base revenues. IOC Adjustments are budgetary adjustments in the
Traditional Budgetary Financial Report.
9
1 The State can provide no assurance that spending reductions, revenue changes or additional appropriations will be passed by the General Assembly or signed into law
by the Governor.
2Cash basis. Does not include transfers in from Budget Stabilization Fund 3 Estimated expenditures based on FY2016 spending as of 9/26/16, does not reflect IOC budgetary adjustments. Estimated expenditures are only those processed by
Comptroller via appropriation, continuing appropriation or court order/consent decree during FY 2016 and FY 2016 lapse period.
4 Estimate of FY 2016 General Funds liabilities not appropriated. Does not include higher education.
the end of the fiscal year
appropriations were enacted
debt service were made
enacted and spending occurred through statutory transfers, statutory continuing appropriations, court orders and consent decrees. Such spending is estimated to total $31.3 billion in categories such as:
covered by consent decree
higher education
liabilities were not appropriated in FY 2016, but these may be paid from future year appropriations
FY 2016 Estimated General Funds Results ($ millions) FY 2016 Estimated Base Resources State Sources $26,127 Transfers In2 1,581 Total State Sources 27,708 Federal Sources 2,665 Total Resources $30,373 Estimated Budgetary Expenditures3 $26,850 Statutory Transfers Out 2,472 Debt Service 1,979 Total Transfers 4,451 Total Expenditures $31,301 Estimated FY16 Operational Liabilities Not Paid 4 3,000 General Funds Surplus (Deficit) ($3,928)
not advanced. After this date, changes in law and appropriations with an immediate effective date require approval of 3/5ths of each chamber through December 31, 2016
State spending that includes:
FY 2017, including debt service appropriations for Metropolitan Pier, Illinois Sports Facilities Authority and State Civic Center Bonds
interfund borrowing
Education and Personal Property Tax Replacement Fund to pay bills – taking some pressure off of limited General Funds resources
rates, saving over $20 million in FY 2017 and hundreds of millions over the next 20 years
10
1 The State can provide no assurance that spending reductions, revenue changes or additional appropriations will be passed by the General Assembly or signed
into law by the Governor.
11
mirror the pattern seen in FY 2016
education and critical state agency operations
2017, including Medicaid, state employee payroll, and certain social services payments
including State employee health insurance, State agency operations, certain social service programs and higher education. Estimates
General Funds Expenditures2 ($ in billions) FY 2016 Estimated FY 2017 Projected3 Enacted Appropriations $7.3 $8.4 Continuing Appropriations 0.4 0.6 Pensions Contributions 4 6.7 6.9 GO Bond Debt Service Transfers 2.0 2.4 Other Statutory Transfers 2.5 2.5 Court Orders/Consent Decrees $2.4 13.5 Estimated Subtotal $31.3 $34.3 Estimated Cost of Additional Liabilities 3.0 3.3 Estimated Total $34.3 $37.6
1 The State can provide no assurance that spending reductions, revenue changes or additional appropriations will be passed by the General Assembly or signed
into law by the Governor.
2 Expenditures are estimates based on GOMB records.
3 FY 2017 Projections are based on current level of established appropriations and GOMB estimates. 4 Pension Contributions are made through continuing appropriation or enacted appropriations.
12
from FY 2016 actual revenues
State spending commitments will exceed forecasted revenues by approximately $5.4 billion
1 The State can provide no assurance that spending reductions, revenue changes or additional appropriations will be passed by the General Assembly or signed into
law by the Governor.
2 Cash Basis. Does not include transfers from Budget Stabilization Fund or interfund borrowing.
General Fund Revenues ($millions) FY 2017 $ increase % increase FY 2015 FY 2016 Forecast Actual Actual (Sept 2016) State Sources: Revenues Net Individual Income Taxes $15,433 $12,890 $12,970 $80 0.6% Net Corporate Income Taxes 2,686 1,972 2,088 116 5.9% Sales Taxes 8,030 8,063 8,170 107 1.3% Total, Income and Sales Taxes $26,149 $22,925 $23,228 $303 1.3% Other State Revenues and Transfers 3,427 3,202 3,145 (57)
Transfers In2 2,981 1,581 1,704 123 7.8% Total State Sources $32,557 $27,708 $28,077 $369 1.3% Federal Sources 3,331 2,665 4,117 1,452 54.5% Total Resources $35,888 $30,373 $32,194 $1,821 6.0%
FY 2013, FY 2014, and FY 2015
expected to also reflect an increase
budget agreement, including looking at financing options to address a portion of the backlog 13
Table Source: Illinois Office of the Comptroller.
1 This amount consists of General Funds Lapse Period Transactions as reported in the Traditional Budgetary Financial Report. 2 Section 25 Liabilities are incurred in one fiscal year and payable from future fiscal year appropriations. This amount is the General Funds portion of Section 25
liabilities and is released with the State’s CAFR.
End of Fiscal Year General Funds Accounts Payable ($ millions) Fiscal Year Fiscal Year Fiscal Year Fiscal Year Fiscal Year 2011 2012 2013 2014 2015 General Funds Budget Basis Accounts Payable1 $4,976 $5,024 $4,142 $4,005 $3,521 General Funds Section 25 Liabilities2 1,604 2,778 1,864 1,622 1,598 Total General Funds Accounts Payables $6,580 $7,802 $6,006 $5,627 $5,119 Section 25 Liabilities - Other State Funds 237 850 489 429 316
the Asset Market Value is $80.0 billion. FY 2016 valuation results will be available in early November 2016
funded at 40.9% as of FY 2015 based on the asset smoothing method and 41.9% using asset market value; individual percentages for each fund vary
in funding levels due to lower than assumed rates of return in FY 2016 and the reduction in the assumed investment rates of return by TRS and SERS and other SERS assumption changes
contributions for FY 2018 that will be based on the results of the FY 2016 valuation
appropriations allow the Retirement Systems to continue to voucher payments for the State’s
cash is available. FY 2016 payments were processed by the end of the State’s lapse period
funds is estimated at just under $8 billion, including $6.9 billion from General Funds
14
$0 $2 $4 $6 $8 $10 $12 $14 $16 $18 $20 2016 Act. 2017 2018 2020 2025 2030 2035 2040 2045 $ Billions
NOTE: Table based on FY 2015 valuations. The State expects that the amount of its contribution to the Retirement Systems beginning in FY 2018 will increase significantly with respect to the State’s contributions in previous fiscal years and shift upwards from the amounts illustrated in the above graph as a result of, among other factors, the reduction in the assumed investment rate of return by TRS and SERS and investment returns substantially lower than those assumed during FY 2016.
15
Security
the General Obligation Bond Act (the “Bond Act”) of the State
another use if needed to pay debt service on GO bonds
Statutorily Mandated Debt Service Set Asides (GOBRI)
Bond Retirement and Interest Fund (GOBRI), in amounts sufficient to pay the next interest and principal payments when due, which effectively results in the State transferring 1/12th of the next principal payment and 1/6th of the next interest payment every month
short-term debt
Appropriation of Funds
amount necessary to pay all principal and interest due and further requires the General Assembly to make appropriations annually to pay debt service on outstanding GO Bonds from GOBRI
appropriation of all amounts necessary to pay principal and interest
Additional Protection under Illinois Constitution and State laws
bonds
thereunder are by their terms irrepealable to any outstanding GO bonds
Assembly that would, under contract law, impair the obligations of a contract between the State and its bondholders
16
2 Does not include debt service transfers on short-term debt as may have been from time to
time outstanding.
billion is estimated for FY 2017, with the balance expected to come from other State funds
average and provide approximately 12.5x coverage on the amount required to be transferred into GOBRI each month for General Funds share of debt service
$- $2,000 $4,000 $6,000 $8,000 $10,000 $12,000 $14,000 2012 2013 2014 2015 2016
$ Millions
Fiscal Year All Fund Cash Balances1
1 Does not include Federal Trust Funds. Includes GOBRI. June 30, 2016
balances show an increase from FY 2015 due in part to the late enactment of FY 2016 appropriations for many State funds. Cash balances totaled $9.8 billion as of August 31, 2016.
Transfers to the GOBRI Fund ($ Millions)2 FY 2012 FY 2013 FY 2014 FY 2015 FY 2016 General Revenue Fund Capital Bonds $ 452.8 $ 548.8 $ 602.9 $ 591.6 $ 556.5 Pension Bonds 1,607.2 1,554.6 1,655.4 1,502.2 1,422.6 Road Fund 332.9 359.3 358.7 346.7 333.7 School Infrastructure Fund 216.3 209.5 208.8 192.8 211.8 Capital Projects Fund 240.8 310.1 344.2 388.0 532.5 TOTAL $2,850.6 $2,982.3 $3,170.0 $3,021.4 $3,057.1
17
1,000 1,500 2,000 2,500 3,000 3,500 4,000 $ Millions Principal Interest
Fixed Rate, 97.7% Hedged Variable Rate, 2.3%
1 As of 8/31/2016. Does not include the Bonds. 2 Reflects the portion of the principal maturing during fiscal year 2017 which has already been paid.
characteristics:
must have level mandatory level sinking fund redemptions matching the level repayment structure
amount, must be by competitive bid
the issuance of GO Bonds, Public Act 99-0523 suspended some of these restrictions for GO Bonds issued for refunding purposes in Fiscal Year 2017
fiscal year’s debt service cannot exceed 7% of last year’s General Funds/Road Fund appropriations
for the issuance of up to $2.0 billion for refunding bonds and $2.0 billion for new money bonds in FY 2017
18
October S M T W T F S 1 2 3 4 5 6 7 8 9 10 11 12 13 14 15 16 17 18 19 20 21 22 23 24 25 26 27 28 29 30 31 November S M T W T F S 1 2 3 4 5 6 7 8 9 10 11 12 13 14 15 16 17 18 19 20 21 22 23 24 25 26 27 28 29 30
If there are any further questions for the State, please contact the following individuals: Financial Advisor Public Resources Advisory Group Christine Fay (610) 565-5990 cfay@pragadvisors.com Joint Bookrunning Senior Managers Bank of America Merrill Lynch Eric Rockhold (312) 537-6734 eric.rockhold@baml.com Jefferies Kym Arnone (212) 336-7303 karnone@jefferies.com
*Tentative, may be accelerated. **Preliminary, subject to change. Expected size: $480 million.