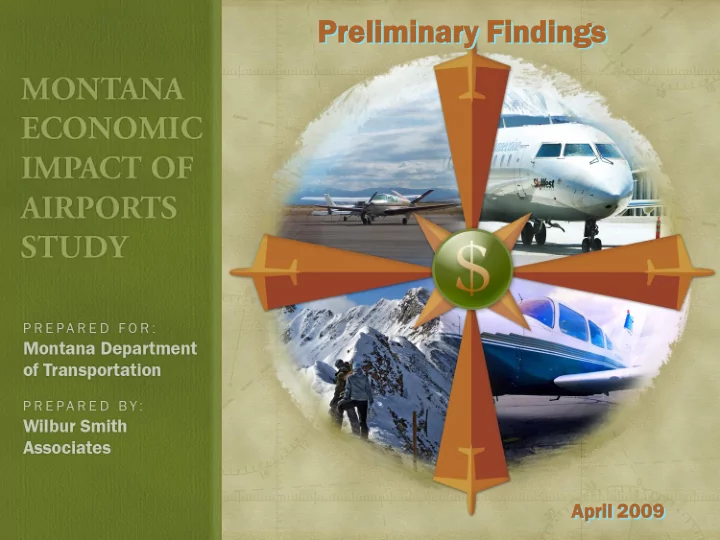
SLIDE 1
Pr Preliminar liminary y Findings ndings
Apri ril 2009
SLIDE 2 STUD UDY OVE VERVI VIEW EW
uantify tify the e value ue of the e Monta ntana na airp rpor
t system
sored by MDT, , Aeron
autics cs Division ion
rity ty FAA AA fun unde ded
18 month nth study udy, , began an Fall l 2007
cluded ded extensi ensive e su survey y effor
Assist sted ed by Morri riso son n Maierle le
llowed ed FAA AA gui uidel eline ines
rports ts analyzed yzed
chures ures prepared red for 72 airp rpor
ts
entif tified ied qua uantitativ itative e and qua ualitat ative e benef enefit its
SLIDE 3 MONTANA AIRPORT SYSTEM
mary y Comme
cial al Servic vice Ai Airp rpor
ts
cial al Es Essenti ential al Ai Air Servi vice ce Ai Airp rpor
ts
lume me Gene neral al Aviation ion Ai Airp rpor
ts (>10K 0K An Annual ual Opera rati tion
s)
lect t Genera neral l Aviation ion Ai Airp rpor
ural Ai Airp rpor
ts
l Ai Airp rpor
ts An Analyze yzed
SLIDE 4 Montana Map
MONTANA AIRPORT SYSTEM
Primary Commercial Airports Commercial EAS Airports High Volume GA & Other Select GA Airports
SLIDE 5
- Montana’s commercial service airports
enplane ane near arly ly 1. 1.48 48 million ion passen enger gers, s, including ding 786,600 ,600 annual visitor
r 292,4 2,400 00 visitor
s arrive e in Monta ntana na annually lly on genera neral l aviation ion aircraf aft
,000 00 annual l itiner nerant ant genera neral aviation ion
erat ations ions
432 regist istered red aircraf aft
MONTANA AIRPORT SYSTEM
SLIDE 6 METHODOLOGY
What Benefits Are Measured in the Montana Economic Impact Study?
On-airpor port t bus usine ness sses es
On-airpor port t capital l imp mprovem emen ents ts
ending
viation bus usine ness sses es depen pende dent nt on airp rports ts
SLIDE 7 What Metrics Are Used to Report Economic Benefits?
s/emplo loym ymen ent t (ful ull-ti time me equi uivalent) lent)
Annual payrol
l/income
Annual econo
mic out utput/ t/valu alue e of goods
servi vices ces – Incl cludes des airp rport t related ed spend nding ng – Incl cludes des all visitor
ending
METHODOLOGY
SLIDE 8 How Was Data for the Study Gathered?
urveys ys of all airp rpor
ts and on-airp irpor
t bus usine ness sses es
On-sit ite e visits s to 35 airp rpor
ts
urveys ys of comm mmer ercial ial airline ne visi sitor
urveys ys of transient nsient (visiting) siting) genera neral l aviation ion pilots
/pas assen senger gers
urveys ys of aviation ion depend penden ent t bus usine ness sses es
condary data so sour urces ces: : FAA AA, USFS, FS, BLM, M, Ho Hospi spitals tals
METHODOLOGY
SLIDE 9
- Input/Output Econometric Model
- IMPLAN Multipliers
Total Economic Impacts Direct Impacts Indirect Impacts Induced Impacts
On On-Airp irpor
t Tenant ants Visitor
iving on Aircra raft
ECONOMIC MODELING
First Round + Second Round = Total
SLIDE 10 What Factors Were Measured in the Direct Impact Category?
On-airpor port t business sses es and tenants ts – FBOs – Airlines – Air Cargo go – Aerial al Applicat ator
al imp mproveme ement nt projects ects (CIP IP) – FAA, MDT, , local l invest estme ment – CIP imp mpacts cts averaged ged over er multi-year r period
– CIP Impa mpacts cts at GA airp rports ts are transien ient t
METHODOLOGY
SLIDE 11 What Factors Were Measured in the Indirect Impact Category?
ending g (comm
ercia cial l and genera neral aviation) ion) – Cumulativ lative e visitor
ing = indirect irect annual l econ
mic activi vity ty/o /output tput – $1 million
endin ding g suppor
ts 19 jobs – Jobs s suppor
ed by visitor
ing are primar aril ily y in the e hosp spit itality/t lity/tour
ism m indust stry
METHODOLOGY
SLIDE 12 How Are Induced (Multiplier) Impacts Estimated?
ultipli lier ers us used d to measu sure re econom
c cycle le that t starts ts with h airp rpor
ts/vi /visitor
ultipli lier ers applied ed to both
ct and Indi dire rect ct Impa mpacts cts to estima imate e Induc duced ed Impacts cts
deling g proce cess s traces es re-sp spen ending ding of initial al dollar lars
METHODOLOGY
SLIDE 13 EXAMPLE AIRPORT
Billings ngs Logan n In Inte ternati rnational
rport
rect On Ai Airp rpor
t Tenan nant t Impa mpacts cts
urvey y Data Indi dica cates – 32 Bus usiness ness & Governm ernment nt Tenan nants ts On Ai Airp rpor
– $90.3 0.3 Million
Annual ual Out utput ut – 674 Em Emplo loyees es – $27.5 .5 Million
Annu nual l Pa Payrol
SLIDE 14
urvey y Data and Model del Indic dicat ate: e: – $11.0 .0 Million
rage ge CIP On Ai Airp rpor
– 147.5 .5 Em Employee ees – $5.22 .22 Million
Annual ual Pa Payroll ll
EXAMPLE AIRPORT
rect On Ai Airp rpor
t Constr nstructi tion
mpacts cts
Billings ngs Logan n In Inte ternati rnational
rport
SLIDE 15 Annual CS Enplanements Estimated CS Visitors Total Annual Number of Days Stayed Annual CS Visitor Expenditures 415,300 207,650 664,480 $60,740,100
ndirect Comme
cial al Servi vice ce Visitor
mpact acts
urvey y Data Indi dica cates – 50% of Enp Enplani ning ng Pax Pax at BIL L are Visitor
– 3.2 2 Days Stayed d on Average age – $91 Ex Expend enditure ture Per Visitor
EXAMPLE AIRPORT
Billings ngs Logan n In Inte ternati rnational
rport
SLIDE 16
0.74 4 Million
uppor
ts – 1, 1,165 65 Jobs s in the e Visitor
dustr try – $22.7 2.7 Million
Annual ual Pa Payroll ll
ndirect Comme
cial al Servi vice ce Visitor
mpact acts
EXAMPLE AIRPORT
Billings ngs Logan n In Inte ternati rnational
rport
SLIDE 17 True Transient Arrivals Estimated GA Visitors Total Annual Number of
Days Stayed
Annual GA Visitor Expenditures 8,270 33,080 62,852 $6,285,200
ndirect Gene neral al Aviation ion Visitor
acts ts
urvey y Data Indi dica cates – 4 Pax Pax per Gener neral al Aviation ion Ai Aircraf aft – 1. 1.9 9 Days Stayed d on Average age – $100 00 Ex Expenditure enditure Per Person son
EXAMPLE AIRPORT
Billings ngs Logan n In Inte ternati rnational
rport
SLIDE 18
.29 Million
nerates – 120.5 0.5 Jo Jobs in the e Visi sitor
dustry – $2.34 .34 Million
Annual ual Pa Payroll ll
ndirect Gene neral al Aviation ion Visitor
acts ts
EXAMPLE AIRPORT
Billings ngs Logan n In Inte ternati rnational
rport
SLIDE 19
EXAMPLE AIRPORT
Billings ngs Logan an In Inte ternat rnational ional Airpor rport
Indiv ividu idual al Airpor rport t Brochure hure Summa ummary y Table ble
SLIDE 20
First-Round Total Employment 12,134.5 18,743.5 Payroll $360.2 Million $600.0 Million Output $941.7 Million $1.55 Billion
Impacts of All Airports
Statewide Economic Impact
SLIDE 21
Airp rpor
ts in Monta ntana na sup uppor
t nearly arly 18 18,750 750 jobs s which ich repres resents nts 4 percen ent t of all jobs bs in the e State. e.
al econ
c imp mpact ct for Monta tana na airp rports ts compr pris ises es 4.5 percent of Montana’s Gross State Product
Statewide Economic Impact
SLIDE 22 88% 5% 4% 2% 1% 0%
Primary (7) Commercial EAS (8) High Vol. GA (20) Select GA (37) GA CIP (57) Rural (48)
Breakout by Airport Category
Statewide Economic Impact
SLIDE 23
First-Round Total Employment 10,865.0 16,623.5 Payroll $321.9 Million $534.2 Million Output $822.9 Million $1.35 Billion
Primary CS Airport Impacts
Statewide Economic Impact
SLIDE 24
First-Round Total Employment 528.5 861.5 Payroll $16.9 Million $28.4 Million Output $47.5 Million $79.7 Million
Commercial EAS Airport Impacts
Statewide Economic Impact
SLIDE 25
First-Round Total Employment 492.0 820.5 Payroll $13.8 Million $23.3 Million Output $38.6 Million $63.8 Million
High Volume GA Airport Impacts
Statewide Economic Impact
SLIDE 26
First-Round Total Employment 257.5 529.5 Payroll $2.9 Million $5.1 Million Output $22.5 Million $37.0 Million
Select GA Airport Impacts
Statewide Economic Impact
SLIDE 27
First-Round Total Employment 4 9 Payroll $142,600 $266,100 Output $288,200 $478,200
Rural GA Airport Impacts
Statewide Economic Impact
SLIDE 28
First-Round Total Employment 132 218 Payroll $6.4 Million $10.6 Million Output $9.8 Million $16.4 Million
GA Airport Construction Impacts
Statewide Economic Impact
SLIDE 29 QUALITATIVE BENEFITS OF AIRPORTS IN MONTANA
Hospi spital tal Survey y Data
- Over 88 percent of Montana’s hospitals rely on air
ambulan ulance ce services ices
ent t of hospit ital als s reported ed flying ng doctor
s and nurses es in to local al hospit ital als s for clinic nics
n a qua quarter er of hospi pita tals s requi quire e the services ices
r carg rgo
ress s compa panie ies s
ance ce services ices to transpor sport t critica ically y ill patien ents, ts, somet metim imes es to cities es as fa far away as Salt t Lake City y and Seattle. ttle.
SLIDE 30
cent t of all fires es initiall ially y repor
ed by aircraft t while le 5 percen cent t are repor
d by agenc ncy y look
ut towers
ent t of all wildl dland and ur urban an inter erface ace acres es on fire e rely y on fixed ed wing g tanker aircraf aft
ent t of all wildla dland nd ur urban an inter erface ace acres es on fire e rely y on helicop icopters
er aircraft t sup uppor
cent t of all acres es bur urne ned d in the e state e
ejumper per bases ses in Miss ssou
a and Yellowstone
QUALITATIVE BENEFITS OF AIRPORTS IN MONTANA
Wildland Firefighting
SLIDE 31
usiness iness sur urveys ys conduct nducted ed
led each h industr dustry y sect ctor
e state
tima mated d that t nearly arly $11.8 1.8 billion, ion, or 38 percent, in the State’s Gross Domestic Product is reliant ant on the e availabi bility lity of comme mmercia cial l servi vice ce airline nes. s.
s transl slates s into
ximately ely 166,800 ,800 jobs s in the e st state e depen pending ding on the e availability bility of comm mmer ercia cial l aviation ion. .
VALUE-ADDED BUSINESS BENEFITS
SLIDE 32
- 1. Highway access
- 2. Trained workforce
- 3. Tax incentives
- 4. Cost of living
- 5. Commercial service airport
- 6. Proximity to suppliers
- 7. Universities, academic and R&D centers
- 8. General aviation airport
- 9. Urban
10.Rail transport 11.Historic location 12.Raw materials 13.Water transport
ACCESS TO AVIATION IS A CRITICAL FACTOR FOR BUSINESS LOCATION
SLIDE 33
Thank You!
Qu Quest estio ions? ns??