
SLIDE 1
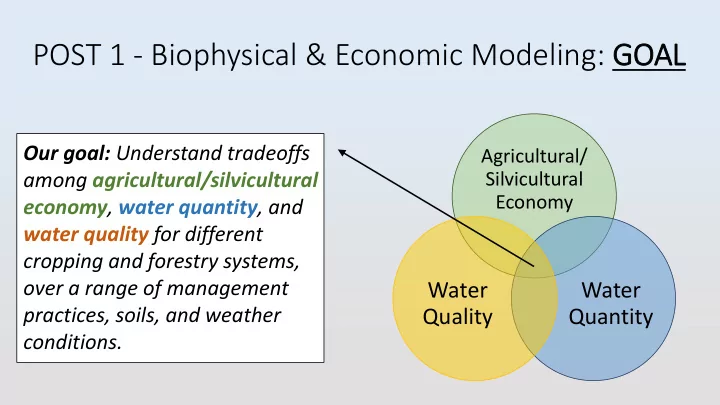
Agricultural/ Silvicultural Economy
Water Quantity Water Quality
POST 1 - Biophysical & Economic Modeling: GOAL
Our goal: Understand tradeoffs among agricultural/silvicultural economy, water quantity, and water quality for different cropping and forestry systems,
- ver a range of management