poor research design
play

Poor Research Design Ive got a great idea I suppose I should What - PowerPoint PPT Presentation

Poor Research Design Ive got a great idea I suppose I should What research problem Im going to develop it in I know from COMPGA11 for some security do a user study to can I think of, which C++, and Id love to use that I must have


  1. Poor Research Design I’ve got a great idea I suppose I should What research problem I’m going to develop it in I know from COMPGA11 for some security do a user study to can I think of, which C++, and I’d love to use that I must have a software! see how people use involves a user study and those cryptographic research problem it would use my security libraries I’ve recently read software? about • 
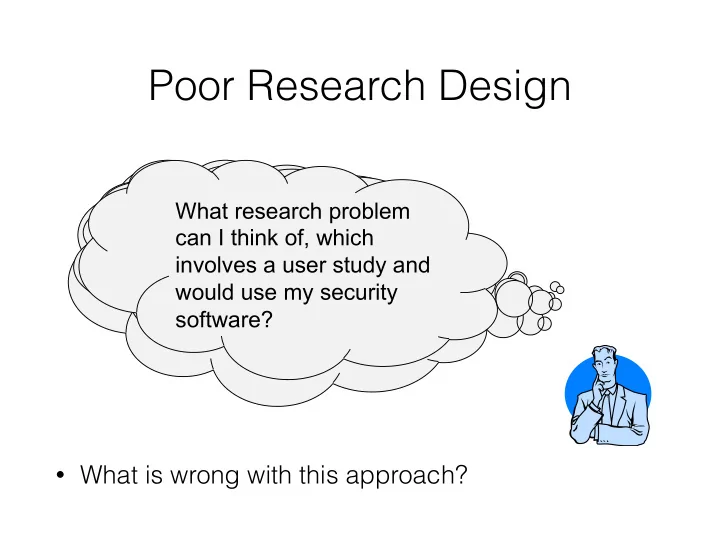
What is wrong with this approach?

  2. Research Design in Context • Remember to follow the scientific method • Identify the research problem • Specify purpose of research • Determine hypotheses/research question • Carry out a literature review • Determine best research method " • Study, develop software, mathematical proof " • Carry out research - data collection • Analyse data • Report results • Draw conclusions from research • Adjust theory

  3. Research Types • Primary research • Using primary sources and/or data • Often used by historians – e.g. studying ancient documents • Analysis of raw data from existing or new studies • Secondary research • Using secondary sources • Synthesis or analysis of existing discussions of primary sources • Case studies • Meta-analyses • Literature survey

  4. Qualitative Research • Often a fairly broad research question • Good for exploratory research • Address questions about human behaviour • Data collected is usually word-type • Used in social and management sciences

  5. Qualitative Research • Not quantifiably measuring variables • Not looking for relationship between variables • Expensive and time consuming to undertake • Usually small sample sizes

  6. NVivo

  7. Atlas TI

  8. Quantitative Research • Narrow research question • Empirical investigation of quantitative properties and their relationships • Need to clearly identify variables for experiment • Different types of variables (see later slides) • Data collected is numeric

  9. Quantitative Research • Data analysed with statistical methods • Correlations, regression, means, standard deviations, chi-square ( ! 2 ) for categorical data etc. • Looking for relationships between variables • Correlation and causation

  10. Tools for quantitative research • Excel • Dangerous: easy to make errors, scales poorly, limited number of techniques • R • Excellent set of libraries connected to mediocre programming language • Python • Good set of libraries connected to good programming language • Julia • Promising approach, but still in rapid development

  11. Repeatability in analysis • Repeatability is just as important in analysis as it is in performing experiments • Tools can help here • Minimum requirement: version control (e.g. Git, Subversion, Mercurial, Bazaar) • Strongly recommended: tool to manage experimental runs: e.g Sumarta, Vistrails • Logs what tools were run and from where output came from (version and parameters)

  12. Mixture of Methods • Possible study #1 • Code transcripts from focus groups (qualitative) • Answers from a survey (quantitative) • Categorical variables e.g. age, education • Investigate relationship between categorical variables and codes from transcripts • Chi-square analysis ! • Possible study #2 • Q methodology – identify different viewpoints • Participants order statements - “Q-sort” • Results of Q-sort undergo factor analysis

  13. A Good Experiment ! • Reminder : Experiments manipulate the topic under study • Different from observational study ! • Provides sufficient data to support or refute the hypothesis – i.e. experiment is valid

  14. A Good Experiment ! • Only tests one variable • If more than one variable, which one affected result? • Is unbiased – researcher does not let their opinions influence the experiment • Is repeated – not a ‘one-off’ • Attempts to remove all external factors which may influence experiment • e.g. lab environment, time of day, equipment, etc. • Really difficult to achieve with human subjects

  15. Variables ! • Something in an experiment which can vary, or be deliberately changed by the experimenter • e.g. temperature of gas, height a ball dropped from, length of password in characters • Sometimes researcher not aware of all variables influencing an experiment • e.g. Trying to measure affect of keyboard design on typing speed, but perhaps temperature of room influences participants’ typing speed.

  16. Types of Variables • Independent variable (sometimes called factor) • Manipulated by the researcher – e.g. password length • Experiment must only change one variable • Dependent variable • Hypothesized to change if independent variable changes • Effect is observed and measured - data collected • State how dependent variable measured and units • Controlled variable • Variable not allowed to change

  17. Independent & Dependent Variables • Charles’s Law – simply put • As temperature increases – volume of gas expands • As temperate decreases – volume of gas decreases • Design the experiment • What could be the independent variable? • What could be the dependent variable? • What could be a controlled variable?

  18. Control Group • Some studies have a control group • Different from a controlled variable • What happens if independent variable is not changed? • Not all experiments have control groups • Common in drug trials – use of placebos • Could you have a control group with an information security experiment?

  19. Within Subjects/Paired Design • Each participant has one treatment and two measurements • One sample group of participants • e.g. time to complete a task before and after training • Advantages • Few subjects – can be quicker • Removes risk of introducing confounding variables • Disadvantages • Participants may drop out • Need to remove them from data set • Participants may suffer from fatigue and practice effects

  20. Between Subjects/Independent Design • Two or more groups of participants have same treatment and measured once • e.g. measure of privacy concern between old and young • Look for statistically significant difference between means of groups • Advantages • Less risk of participants dropping out • Participants unlikely to suffer fatigue and practice effects • Disadvantages • Higher risk of introducing confounding variables • More participants needed – takes more time

  21. Sampling Bias • Statistical term • Important in surveys and user trials • Sample population not representative of total population • Members of total population less likely to be included in sample • Non-random sample - all individuals not equally likely to be selected

  22. Sampling Bias • Examples • People at a local painting club used to determine views concerning funding of the arts in the UK – (qualitative) • Average male height in UK determined by measuring people in local basketball team – (quantitative) • Aim to minimise bias • Papers likely to be criticised if there is obvious sampling bias • Undermines ability to generalise to total population • Also impacts between subjects/independent experiment design

  23. WEIRD • Experiments typically performed on: • Western • Educated • Industrialized • Rich • Democratic countries • Around 12% of the population

  24. Which line is longer? 
 (Müller-Lyer illusion)

  25. The weirdest people in the world? Henrich et al. (2010)

  26. Selection Bias • Selection bias leads to sampling bias • Terms often used interchangeably (incorrectly) • Sampling bias is a sub-type of selection bias • Other types of selection bias: • Terminate trial when result achieved • Discounting drop outs

  27. Selection and Sampling Bias Selection Bias Asking your friends to take part in your study Sampling Bias Sample not representative of total UK/ world population • In Method section of paper • Provide description of selection process and any limitations • Provided description of sample collected and any limitations

  28. Structured Sampling ! • May want to deliberately manage sampling • Deliberately select participants based on criteria • Example: • Focus groups to discuss television viewing habits • Objective of selection process is to get a good coverage of ages and regions in the UK

Download Presentation
Download Policy: The content available on the website is offered to you 'AS IS' for your personal information and use only. It cannot be commercialized, licensed, or distributed on other websites without prior consent from the author. To download a presentation, simply click this link. If you encounter any difficulties during the download process, it's possible that the publisher has removed the file from their server.

Recommend


More recommend