
SLIDE 1
PLEASANTVILLE PUBLIC SCHOOLS Absecon Public Meeting May 28, 2019 - - PowerPoint PPT Presentation
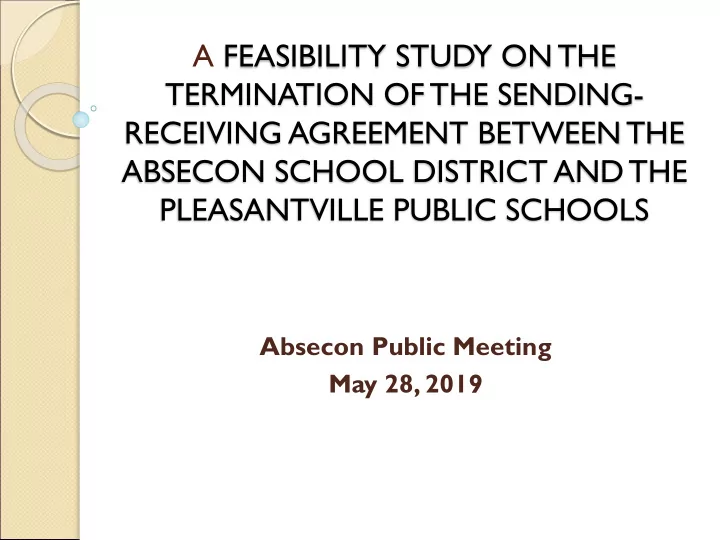
A FEASIBILITY STUDY ON THE TERMINATION OF THE SENDING- RECEIVING AGREEMENT BETWEEN THE ABSECON SCHOOL DISTRICT AND THE PLEASANTVILLE PUBLIC SCHOOLS Absecon Public Meeting May 28, 2019 Educational Options Mainland Regional High School
Over 50 years of experience as a Teacher, Principal, and School
Superintendent, including 6 years as the Essex County Superintendent of Schools.
Possess as Masters of Arts in Education Administration from Hofstra
University
Testified as an expert witness in Educational Administration &
Curricular and Co-curricular Programming K-12 before the Office of Administrative Law.
An examination of the SAT/AP [Scholastic Aptitude Test/Advanced
Placement] data shows the stark difference between the Absegami/Mainland pupil population and that of Pleasantville.
Of particular note is the AP participation and the number of courses
send/receive arrangement demonstrate that participation and performance are comparable in these areas, with Mainland Regional demonstrating a slight edge.
There is no significant difference between the two with respect to the
Graduation or Dropout Rate or Post-secondary enrollment. In the area of Technology Devices, Absegami enjoys an enviable ratio in that regard. Pleasantville High School lags far behind with respect to 4yr&2yr Post-Secondary enrollment, and lists a Graduation Rate under 90%.
Category
Mainland Absegami Pleasantville SAT Participation
100% 100% 70%
SAT Performance – Reading and Writing
565* 543
453 SAT Performance – Math 560* 542 458 AP Participation 33%* 27.8% 15% AP Score of 3 or above 64%* 61%* 24.3% # of AP (IB)** Courses offered 24* 18* 7 Graduation Rate 95.9% 91.8% 86.6%% Post-Secondary Enrollment 4yr/2yr 76.5% 73.1% 45% Dropout Rate 0.8% 0.4% 0.4% Instructional Time 6hrs.39mins
Length of School Day 7hrs.25mins
Student Suspension Rate 8.6% 22.0% 31.8% Violence, Vandalism, HIB, Substance Incidents 39 67 51 Student to Technology Device Ratio 4.5:1 1.2:1 4.6:1 Student to Teaching Staff Ratio 12:1 11:1 10:1 Accountability Indicator – Support Required No No No
Source: NJ Performance Report for 2016-2017 School Year, except where noted as *which is a 2018 data point
sourced from the most recent District statistical literature. **There is no International Baccalaureate Program offered in any of the three high schools. *** Length of School Day was reported as 6hrs 35 mins which obviously was in error, as it cannot be less than the school’s total instructional time.
The comparison of the educational services being offered at the
various schools support a change in the 9-12 instructional location for Absecon students.
Mainland’s data demonstrates a slightly stronger performance by
its students over the Absegami pupil population.
However, Absegami High School is educationally preferential as
a 9-12 destination for the Absecon pupils, due to geographic proximity and the historical community integration with Absecon.
Galloway, the location of Absegami High School, is much
closer (by four miles) to Absecon.
Absegami High School publicizes in its Curriculum Guide
various “orientations” for eighth grade students (Open House, Shadow Program, Academic Night…).
Therefore, it appears that Absegami goes to significant length
to ensure successful matriculation of its students into the high school.
Either Mainland or Absegami would serve the instructional needs of
rising Absecon 8th graders.
Each institution educates about 1300 pupils and offers curricular and
co-curricular programs of benefit to a student.
Audited revenues and expenditures from 2015-16 & 2016-17.
Projections averaged over five years.
The present organizational structure and alternative configuration were calculated as if fully implemented at the beginning of the 2019-20 school year.
Each community's tax levy and rate were estimated for purposes of comparing alternative configurations only and not to approximate the actual future tax levy and rate.
Estimates of revenues, expenses, tax levies and tax rates were expressed in 2017 dollars.
Estimates of future enrollment were prepared using the Cohort-Survival Ratio method.
State aid for each district, before and after reconfiguration, approximate 2016-17 rates.
State aid for existing debt service will continue at the 2016-17 rate.
Educational programs were assumed to be equivalent to those that existed in each district during the 2016-17 school year.
Tuition rates reflect the actual cost per pupil for students under any of the alternatives.
Status Quo High School Send-Receive Greater Egg Harbor High School Send-Receive Mainland Community: City of ABSECON Tax Levy* $11,858 $11,765 $11,809 Tax Rate+ $1.582 $1.570 $1.575 Savings (loss)* $93 $49 Rate Change $0.012 $0.007 Community: City of PLEASANTVILLE Tax Levy* $10,940 $11,291 Tax Rate+ $1.478 $1.526 Savings (loss)* ($351) Rate Change ($0.047) Community: GREATER EGG HARBOR REGIONAL Tax Levy* $34,498 $34,157 Tax Rate+ $0.603 $0.597 Savings (loss)* $341 Rate Change $0.006 Community: MAINLAND REGIONAL Tax Levy* $19,190 $18,909 Tax Rate+ $0.651 $0.6417 Savings (loss)* $281 Rate Change $0.01 Note: *In thousands; + $/$100 Equalized Tax Value
Reduction in 38 Absecon students result in reduced staff and
With 350 certificated teachers, any loss in staff could be
handled through attrition.
Approximate net loss to Pleasantville: $351,000. Less than one half of one cent per hundred dollars of
equalized property value.
When fully implemented the tax levy increase is less than
0.4% of the total 2016-17 expenditures.
Represents $0.83 per week on the average assessed home
in Pleasantville.
Phase-in:
$88,000 annually or less than 0.1% of audited expenditures.
Doctorate from Rutgers University Graduate School
21 years' experience as a demographic consultant Numerous publications on school demography and
Testified
1. Population trends
Absecon, Pleasantville, Mainland Regional, and Greater Egg Harbor Regional Absecon- 2017 population estimate = 8,283 2. Relevant Demographic Characteristics in each community (e.g., race, education, income, median housing price, etc.) Absecon has become more racially diverse from 2000-2010 Blacks are largest race in Pleasantville but declining. Hispanics -41% in 2010 Mainland Regional has highest SES, highest home prices, and largest White percentage
four communities.
3. Historical enrollment trends (2012-13 to 2017-18) in each school district. Absecon 9-12 has been declining. Pleasantville HS enrollment has been fairly stable. Greater Egg and Mainland have had declining enrollment. 4. Birth counts in each community were used to project kindergarten students five years later
5. New housing in each community Absecon- Mi Place at the Shore (400 apartments, 30 TH of which 99 are age-restricted. 249 COs as of September 2018. 6. Enrollment Projections in each district 37-40 Absecon students are projected
7. Capacity Analysis – Will other potential schools be able to accommodate Absecon students?
Mainland, Oakcrest, and Absegami have ample room to accommodate Absecon students.
Cedar Creek also would have enough room for Absecon students at PHS. If students return from
able to accommodate students.
8. Racial Impact
Impact
removal
Absecon students from Pleasantville HS- No negative racial impact on Pleasantville HS, remains racially diverse (64% H, 34% B)
Impact of Absecon students on new high school and inclusion of Absecon Students on overall student body.
Mainland (69% W, 15% H, 6% B, 5% As) is not as racially diverse as:
Cedar Creek (62% W, 20% H, 14% B, 3% As)
Absegami (43% W, 22% H, 16% B, 16% As)
Oakcrest (41% W, 19% H, 31% B, 6% As)
Richard S. Grip, Ed.D. Peter E. Carter, M.S. Steven Cea, MBA Vito A. Gagliardi Jr., Esq. Kerri A. Wright, Esq.