
SLIDE 1
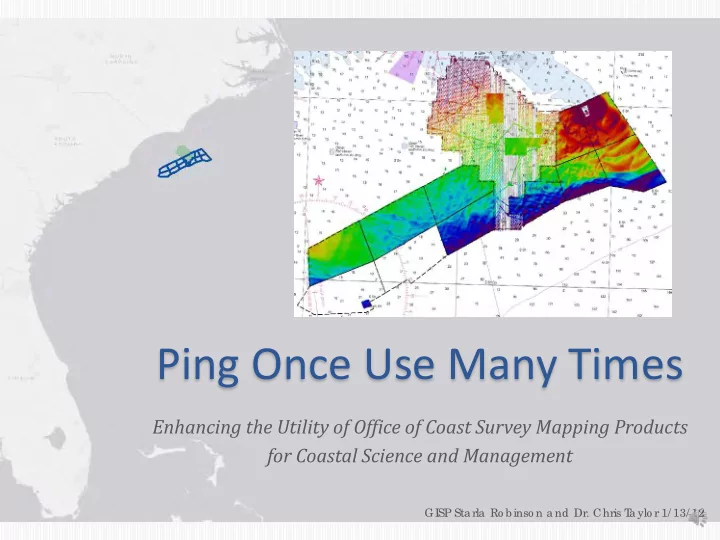
Ping Once Use Many Times
Enhancing the Utility of Office of Coast Survey Mapping Products for Coastal Science and Management
GISP Sta rla Ro b inso n a nd Dr. Chris T a ylo r 1/ 13/ 12
Ping Once Use Many Times Enhancing the Utility of Office of Coast - - PowerPoint PPT Presentation
Ping Once Use Many Times Enhancing the Utility of Office of Coast Survey Mapping Products for Coastal Science and Management GISP Sta rla Ro b inso n a nd Dr. Chris T a ylo r 1/ 13/ 12 Wilmington 2016: For the Chart Updated Chart 900 Square
Enhancing the Utility of Office of Coast Survey Mapping Products for Coastal Science and Management
GISP Sta rla Ro b inso n a nd Dr. Chris T a ylo r 1/ 13/ 12
Updated Chart 900 Square Nautical Miles Bathy/Habitat Data 570 Square Nautical Miles
Ping Onc e Use Ma ny T ime s 2017
Ping Onc e Use Ma ny T ime s 2017
Updated Chart 900 Square Nautical Miles Bathy/Habitat Data 570 Square Nautical Miles
Ping Onc e Use Ma ny T ime s 2017
OCS HSD – NCCOS – OMAO - UNH NOAA JHC CCOM How did this all come together?
Ping Onc e Use Ma ny T ime s 2017 E nha nc ing the Utility o f Co a st Surve y Pro d uc ts fo r Co a sta l Sc ie nc e a nd Ma na g e me nt
and ecosystem management-
/ Center for Coastal & Ocean Mapping (JHC)
Office of Marine and Aviation Operations (OMAO)
Ping Onc e Use Ma ny T ime s 2017
Hydrographic Survey Division - Operations
Ping Onc e Use Ma ny T ime s 2017 E nha nc ing the Utility o f Co a st Surve y Pro d uc ts fo r Co a sta l Sc ie nc e a nd Ma na g e me nt
http :/ / www.na utic a lc ha rts.no a a .g o v/ nsd / re ps.htm
Hydrographic Health Model
(Risk, De sire a nd De c a y: E sta b lishing Surve y Prio ritie s thro ug h the Asse ssme nt o f Hyd ro g ra phic He a lth, Go nsa lve s, Alle n, F a nd e l, Ga lla g he r, Hic k, K e o wn CHC2016)
NOAA Hydrographic Survey Priorities
Coastal Mapping (IOCM) Priorities - Seasketch
coordination (OMAO, COOPS, RSD, NSD)
F
NOAA.Ma ps.a rc g is.c o m
available?
(HSD, IOCM, MCD)?
do we have on project?
capabilities
Outside Source Data Resources:
2011 Vessel Density (map service)
Ping Onc e Use Ma ny T ime s 2017
H04523
Lead line survey By the USCGS S Lydonia
(Sources: Survey Index – SURDEX; and NCEI)
U.S. Naval Historical Center Photograph. http://www.history.navy.mil/photos
16
Feature sounding depths are in meters. Chart is in fathoms.
Obstruction
Ping Onc e Use Ma ny T ime s 2017
Collected by NCCOS with Geodynamics and NOAA Ship Nancy Foster
Ping Onc e Use Ma ny T ime s 2017 E nha nc ing the Utility o f Co a st Surve y Pro d uc ts fo r Co a sta l Sc ie nc e a nd Ma na g e me nt
number
navigationally significant contacts
levels was applied
Ping Onc e Use Ma ny T ime s 2017
*
Ping Onc e Use Ma ny T ime s 2017 E nha nc ing the Utility o f Co a st Surve y Pro d uc ts fo r Co a sta l Sc ie nc e a nd Ma na g e me nt
124 Ft (38m)
12 ft (3.8m)
Ping Onc e Use Ma ny T ime s 2017
www.nauticalcharts.noaa.gov
Charts
www.ngdc.noaa.gov
Ping Onc e Use Ma ny T ime s 2017
bottom samples
Ping Onc e Use Ma ny T ime s 2017
The prototype drop camera connects between the line and the grab sampler, alternatively it can be deployed with a drop frame.
correction.
for finer sediment comparisons.
Ping Onc e Use Ma ny T ime s - 2017
Identification
is empty
Washout
Ping Onc e Use Ma ny T ime s - 2017
Ping Onc e Use Ma ny T ime s 2017
Ping Onc e Use Ma ny T ime s 2017
SE US Continental Shelf!
South Florida!!
Discriminating habitats from acoustic signatures
Ping Onc e Use Ma ny T ime s 2017
Ping Onc e Use Ma ny T ime s 2017
Aggregate Reef Spur and Groove Pavement w/ soft coral Fine Sand Rhodoliths Coarse Sand waves
Patch Reef Ledge Sand Pavement
* Bold labels indicate Essential Fish Habitat (EFH)
Ping Onc e Use Ma ny T ime s - E nha nc ing the Utility o f Co a st Surve y Pro d uc ts fo r Co a sta l Sc ie nc e a nd Ma na g e me nt
likely hard likely soft
Ping Onc e Use Ma ny T ime s - 2017
Fish Habitat, especially permitting offshore energy facilities and sand resource extraction
and other spatial management zones
population connectivity
Where can you go to get the data?
Ping Onc e Use Ma ny T ime s 2017 E nha nc ing the Utility o f Co a st Surve y Pro d uc ts fo r Co a sta l Sc ie nc e a nd Ma na g e me nt
Ping Onc e Use Ma ny T ime s 2017
http://www.ngdc.noaa.gov/ http://www.nauticalcharts.noaa.gov/
Project image.tarball Link
Marine Geology Datasets
Ping Onc e Use Ma ny T ime s 2017
Ping Onc e Use Ma ny T ime s 2017
IHO-S57
International Hydrographic Organization Special Publication 57 – Transfer standard for digital hydrographic data for electronic chart systems.
CMECS
Coastal and Marine Ecological Classification Standard
Ping Onc e Use Ma ny T ime s 2017
charting and the resulting bottom samples and backscatter can be used as preliminary data for classifying the sea floor.
Bathymetry Viewer.
bottom sampler images.
with additional sediment sample ground truthing and validation.
OCS / NCCOS / IOCM / OMAO / UNH-NOAA JHC CCOM / NCEI Thanks everyone! I believe NOAA’s strength is in our ability to collaborate, and this project would not have happened without you.
Ping Onc e Use Ma ny T ime s 2017 E nha nc ing the Utility o f Co a st Surve y Pro d uc ts fo r Co a sta l Sc ie nc e a nd Ma na g e me nt
Acknowledgments
NCCOS: Dr. Chris Taylor OCS - HSD: GISP Starla Robinson, LCDR Gonsalves, Corey Allen, Kyle Ward, IOCM UNH-NOAA JHC CCOM: Dr. Juliet Kinney, Michael White OCS- IOCM: Ashley Chappell, LT Reed OCS- Atlantic Hydro Branch: LDCR Welton, Vanessa Miller, Matt Wilson, Jeff Marshall, James Miller, Melody Ovard, Brian Mohr. NOAA Ship Ferdinand R. Hassler: LCDR Jaskoski, LT Morgan – and the rest of the crew! Augmenting scientists from the Navigation Response Branch (NRB): Lucas Blass and Cody Guilday from Augmenting crew from NOAA Ship Thomas Jefferson: Head, Seberger, Forrest, Gleichauf, Marcum Augmenting scientist from Hydrographic Systems and Technology Programs (HSTP): John Doroba National Centers for Environmental Information (NCEI): LT Baillio, Marcus Cole, Susan Gottfried, Gina Brewer, Jennifer Jenks, Kelly Stroker , Scott Cross
Fedmap.Seasketch.org
http://arcg.is/1pnDX7m
http://maps.ngdc.noaa.gov/viewers/marine_geology
https://www.ngdc.noaa.gov/nos/H12001-H14000/H12600.html
https://www.ngdc.noaa.gov/geosamples/surveydisplay.jsp
www.nauticalcharts.noaa.gov
Ping Onc e Use Ma ny T ime s 2017 E nha nc ing the Utility o f Co a st Surve y Pro d uc ts fo r Co a sta l Sc ie nc e a nd Ma na g e me nt