
SLIDE 1
Jaeyub Chung† Bryan W. Boudouris†,‡ and Elias I. Franses†
†Charles D. Davidson School of Chemical Engineering and ‡Department of Chemistry
Purdue University
2019 Spring P2SAC Conference, West Lafayette, IN, USA Thursday, May 9, 2019
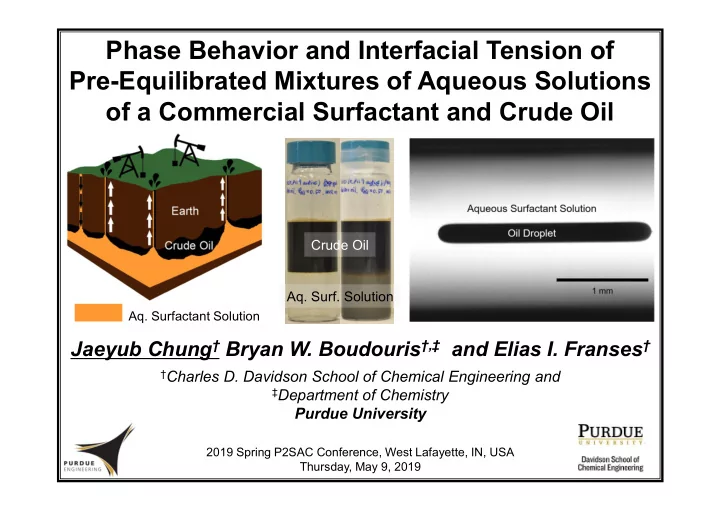
Phase Behavior and Interfacial Tension of Pre-Equilibrated Mixtures of Aqueous Solutions
- f a Commercial Surfactant and Crude Oil
- Aq. Surfactant Solution
Crude Oil
- Aq. Surf. Solution