
SLIDE 1
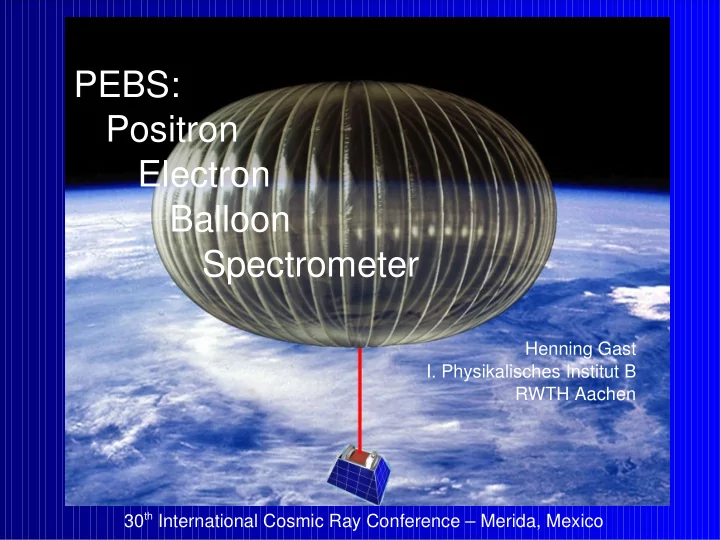
PEBS: Positron Electron Balloon Spectrometer
Henning Gast
- I. Physikalisches Institut B
PEBS: Positron Electron Balloon Spectrometer Henning Gast I. - - PowerPoint PPT Presentation
PEBS: Positron Electron Balloon Spectrometer Henning Gast I. Physikalisches Institut B RWTH Aachen 30 th International Cosmic Ray Conference Merida, Mexico Introduction Goal: Measure the cosmic-ray positron fraction with a
Henning Gast
Goal: Measure the cosmic-ray positron fraction with a balloon-borne spectrometer. Motivation: Indirect search for dark matter. Requirements:
>1000 cm2sr for 20-day campaign
e.g. at 40 GeV: 10-4GeV-1m-2sr-1s-1 x (100x24x3600)s x 0.4 m2sr = 344 e+/GeV
Henning Gast
acceptance @100GeV and mission duration PEBS 4000 cm2sr 100 days AMS02 800 cm2sr 1000 days PAMELA 20 cm2sr 1000 days PEBS schedule 2010 20 days 2011 40 days 2012 40 days 100 days PEBS= 1.4 years AMS02 55 years PAMELA
Tracker: Scintillating fibres (d=250 m) with Silicon Photo- Multiplier (SiPM) readout; power: 260W Time-of-Flight system (TOF): 2 x 2 x 5 mm scintillator, SiPM readout; trigger system! Magnet: Pair of superconducting Helmholtz coils, Helium cryostat, mean B = 0.8T, weight: 850kg Solar panels: power for subdetectors, communications, data handling ~600 W 2.2 m
Electromagnetic calorimeter: 70 x ( 0.5mm W + 6x0.5 mm2 scintillating fibre + SiPM ) = 10 X0, weight: 600kg Transition Radiation Detector (TRD): 2 x 8 x ( 2cm fleece radiator + 6mm straw tube Xe/CO2 80:20 ) Positron acceptance: 4000 cm2sr 2.2 m
Henning Gast
test balloon launch OLIMPO experiment (2008)
High-altitude (~40km), long-duration (~20 days) balloon flights from Svalbard balloonport (ASI) Interesting alternative to space, allows recalibration of experiment as well as multiple journeys
NASA ULDB altitude profile
Henning Gast
8 superlayers of 25 double-layered modules of scintillating fibres, d=250 m, stack of fibres accumulates light on SiPM readout of SiPMs by dedicated VA chip CF skin + Rohacell foam 5x128 fibres tracker module front view 3.2 cm material budget: 12% X0 ( 6% X0 tracker + 6% X0 TRD ) 32x1 silicon photomultiplier 250µm strip width, 100 pixels/SiPM
Perugia
reflective coating SiPM
Henning Gast
trigger scintillators trigger scintillators beam telescope: 4 CMS Si strip modules ~20µm resolution AMS02 panel cooling pipe scintillating fibre bunch + SiPMs + PMT
2 fibre bunches: 3x10 square fibres, d=300 m 3 fibres each to SiPM in copper block copper block
10 GeV p →SiPMs fibres
Henning Gast
5 6 7 12 photo electrons 4 3 8 9 2 1 SiPM type 0606EXP with reflective foil on one side 1 mm excess noise: fibre area = 0.27 x SiPM area dark spectrum: beam telescope hit away from fibre 10 11
Photonique SSPM 0606 EXP S/N=20, eff(0.5pe)=96% SSPM 050701GR S/N=100, eff(0.5pe)=91%
Testbeam results → PEBS MC simulation → muon momentum resolution: a=2.3%, b=0.194%/GeV
p p =a
2b⋅p 2
Simulated 40,000 positrons and 1,000,000 protons proton rejection ~5000 at high energies (electron efficiency ~65%) ECAL energy resolution ~10% dominated by leakage effect
5 GeV positron ECAL shower in Geant4 simulation
3x3 mm2 SiPM array: 8100 pixels 3x3mm2 SiPM 70 x ( 0.5mm W + 6x0.5 mm2 scintillating fibre + SiPM ) = 10 X0 6 0.5
Henning Gast
single TRD module AMS02 TRD octagon integrated at RWTH Aachen workshop TRD superlayer in G4 simulation 2 x 8 layers of fleece radiator, TR x-ray photons absorbed by Xe/CO2 mixture (80:20), in 6mm straw tubes with 30 m tungsten wire Design equivalent to AMS02 space experiment Tasks: proton suppression and tracking in non-bending plane 10.1 cm radiator straw tubes 2.2 m
Henning Gast
proton rejection for positron measurement from first 16 layers protons electrons TRD 20-layer prototype testbeam data Analysis of TRD prototype testbeam data proton rejection ~1000 combined TRD+ECAL rejection of 106 → ~1% proton contamination
Henning Gast
Henning Gast
composition of positron component according to PLANETOCOSMICS simulation of atmospheric background and contributions from p/e- misidentification 40 km altitude: 3.7 g/cm2 remaining atmosphere contributions in absolute numbers for 20-day flight for efficiency = 50%
misidentified protons atmospheric positrons primary positrons misreconstructed electrons
Simulated 40,000 positrons and 1,000,000 protons proton rejection ~4000 at high energies (electron efficiency ~65%) ECAL energy resolution ~10% dominated by leakage effect
Henning Gast
magnet cryostat ECAL TRD 1 tracker TOF Full Geant4 detector simulation available 2.43 m 2.62 m length: 3.23 m TRD 2
Henning Gast
ISOMAX magnet (1998) flown on high-altitude balloon Magnet design by Scientific Magnetics for superconducting pair of Helmholtz coils in He cryostat, mean field 1 Tesla, opening 80x80x80 cm3, weight: 850kg 1.90 m
Henning Gast
8 superlayers of double-layered modules
stack of fibres accumulates light on SiPM readout of SiPMs by dedicated VA chip CF skin + Rohacell foam 2x5x128 fibres tracker module tracker superlayer 0.88 x 0.88 m2 3.2 cm material budget: 12% X0 ( 6% X0 tracker + 6% X0 TRD ) 32x1 silicon photomultiplier 250µm strip width, 100 pixels/SiPM
Perugia
Henning Gast
16x1 silicon photomultiplier, strip width 380 µm need 32x1, 250µm strip width light collection in scintillating fibre in Geant4 simulation x A
4x1 readout scheme (column-wise) with weighted cluster mean better spatial resolution than pitch/√12 , depending on p.e. yield
total power consumption (~50000 channels) of tracker: 260 W fibre module front view, with SiPM arrays on alternating sides
Henning Gast
2 fibre bunches: 3x10 square fibres, d=300 m 3 fibres each to SiPM in copper block copper block 1 mm
Henning Gast
p p =a
2b⋅p 2
Testbeam results → PEBS MC simulation → muon momentum resolution: a=2%, b=0.19%/GeV
Henning Gast
distribution of incident angle projected to bending-plane for PEBS detector 35°
mean= 11.2° p.e. yield of testbeam fibre stack with reflective foil
Henning Gast
Muon momentum resolution from G4 simulation using testbeam parameters, d = 250µm, B=1T p.e. efficiency = 1 x testbeam efficiency
p p =a
2b⋅p 2
a = 2% b = 0.19%/GeV a = 2% b = 0.12%/GeV a = 2% b = 0.14%/GeV p.e. efficiency = 2 x testbeam efficiency p.e. efficiency = 1.5 x testbeam efficiency
Henning Gast
median of angular resolution = 1 mrad at higher energies
bending plane (fibres): 0.2 mrad non-bending plane (TRD): 1 mrad
Henning Gast
5 G e V p
i t r
ECAL shower in Geant4 simulation t=x/X0
dE dt =E 0 b
1
1 t
e −bt
50 GeV e+ 38 GeV e+ 26 GeV e+ 14GeV e+ 50 GeV protons
tmax longitudinal shower profiles cutout view of ECAL in Geant4 simulation 76 cm 16 cm
Henning Gast
cutout view of ECAL in Geant4 simulation 3x3mm2 SiPM 76 cm 16 cm 3x3 mm array: 8100 pixel
3 mm
8 superlayers of ten layers of lead-scintillating fibre sandwich, with alternating orientation 1mm lead fibre: 1mm height, 8mm width, read out by SiPMs 14.3 X0 in total, ECAL weight: 550 kg
Henning Gast
ratio of ECAL energy within one Moliere radius positrons protons angle between reconstructed track and shower positrons protons ECAL energy matching ECAL shower maximum positrons protons reconstructed momentum
Henning Gast
44.5 GeV positron in event display
Henning Gast
intrinsic resolution limited by high-energy 0 production in front of or in first layers of ECAL example event: p → p 0 X in very first ECAL layers, momentum reconstruction off by 1.3σ 0 → → e.m. shower
Henning Gast
intrinsic resolution limited by high-energy 0 production in front of or in first layers of ECAL example event: p →p 0 X before last tracker layer generated: pgen=35.4 GeV 0 momentum: 18.9 GeV → → e.m. shower reconstructed: preco=19.5 GeV
Henning Gast
11B 12C
boron/carbon separation at 5 GeV/n in Geant4 simulation needs to be studied in more detail compilation of B/C measurements and GALPROP prediction
Henning Gast
Analysis of TRD prototype testbeam data electron rejection for antiproton measurement TOF+TRD ECAL +TRD