
SLIDE 1
February 21, 2014
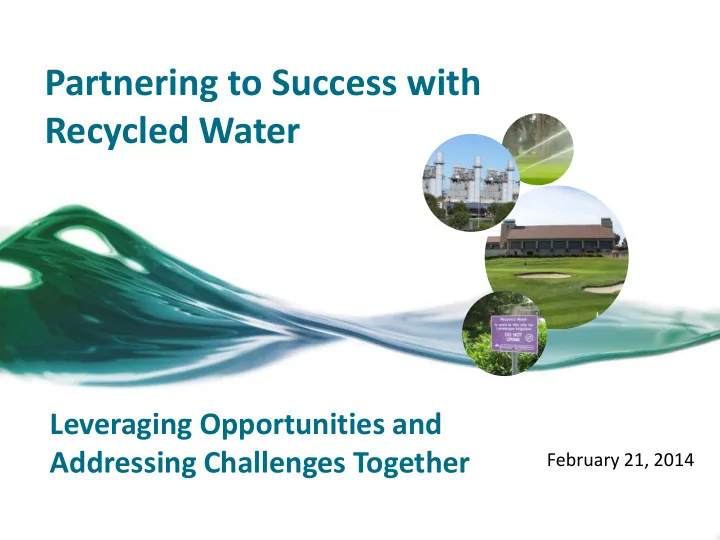
Partnering to Success with Recycled Water Leveraging Opportunities - - PowerPoint PPT Presentation
Partnering to Success with Recycled Water Leveraging Opportunities and Addressing Challenges Together February 21, 2014 Agenda Partnership & Collaboration Survey Summary of Results Importance Challenges &
February 21, 2014
2
3
5
6
Alaska Hawaii
October 2013 Nationwide Recycled Water Survey Results
7
Arizona California Colorado Florida Illinois Missouri Nevada New Mexico North Carolina Pennsylvania South Carolina Texas Virginia Washington Alaska Hawaii
October 2013 Nationwide Recycled Water Survey Results
8
See CA Map (Next Slide)
Arizona California Colorado Florida Illinois Missouri Nevada New Mexico North Carolina Pennsylvania South Carolina Texas Virginia Washington Alaska Hawaii
October 2013 Nationwide Recycled Water Survey Results
9
October 2013 Nationwide Recycled Water Survey Results
10
(Qualifier: Some projects did not report AFY, some a range)
553,875 1,000 4,000 206,021 7,100 5,500
NR
8,900 5,696
NR
7,137 66,390 11,200 1,120
Arizona California Colorado Florida Illinois Missouri Nevada New Mexico North Carolina Pennsylvania South Carolina Texas Virginia Washington Alaska Hawaii
October 2013 Nationwide Recycled Water Survey Results
11
NR – not reported
(Qualifier: Some projects reported a cost range) Note: do not divide $6.4b by 890K AFY
$ 5.7B
$2M $2M $173M
$30M
$700K $450K $40M $12M
$1M
$72.9M $240M
$12M
$12.8M
Arizona California Colorado Florida Illinois Missouri Nevada New Mexico North Carolina Pennsylvania South Carolina Texas Virginia Washington Alaska Hawaii
October 2013 Nationwide Recycled Water Survey Results
October 2013 Nationwide Recycled Water Survey Results
13
October 2013 Nationwide Recycled Water Survey Results
14
October 2013 Nationwide Recycled Water Survey Results
15
Source: Wade Miller, WateReuse Association
16
(source: WateReuse Association)
17
December 2013 reservoir levels in Lake Oroville & Shasta Lake
18
Challenges & Opportunities
Challenges and Opportunities
Opportunities
SRF Terms Annual Debt Service Present Worth of Debt Service* Savings v. $10 M project*
Funding* 30-year, 2.1% $452,662 $7,373,361 $2,626,639 26% 30-year, 1% $387,481 $6,311,635 $3,688,365 37% 30-year, 0.5% $359,789 $5,860,563 $4,139,437 41% 30-year, 0% $333,333 $5,429,624 $4,570,376 46%
25
*Using a 4.5% Discount Rate representative of traditional tax-exempt bond financing rate
26
27
28