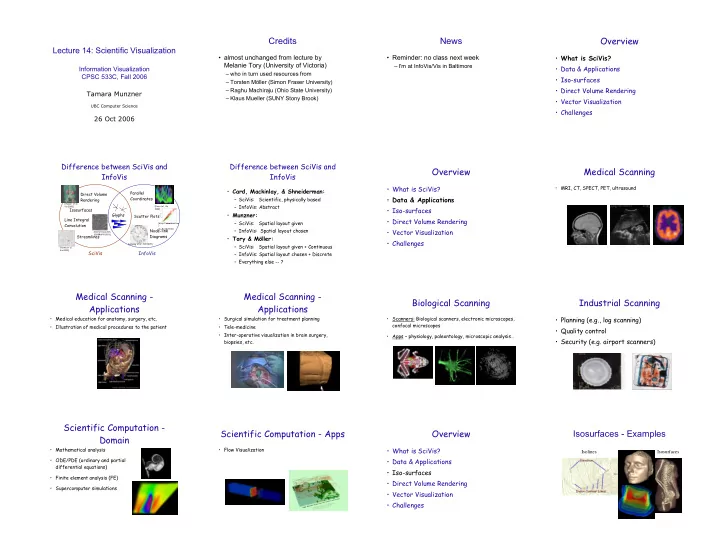

Lecture 14: Scientific Visualization
Information Visualization CPSC 533C, Fall 2006 Tamara Munzner
UBC Computer Science
26 Oct 2006
Credits
- almost unchanged from lecture by
Melanie Tory (University of Victoria)
– who in turn used resources from – Torsten Möller (Simon Fraser University) – Raghu Machiraju (Ohio State University) – Klaus Mueller (SUNY Stony Brook)
News
- Reminder: no class next week
– I'm at InfoVis/Vis in Baltimore
Overview
- What is SciVis?
- Data & Applications
- Iso-surfaces
- Direct Volume Rendering
- Vector Visualization
- Challenges
Difference between SciVis and InfoVis
Direct Volume Rendering Streamlines Line Integral Convolution Glyphs Isosurfaces
SciVis
Scatter Plots Parallel Coordinates Node-link Diagrams
InfoVis
[Verma et al., Vis 2000] [Hauser et al., Vis 2000] [Cabral & Leedom, SIGGRAPH 1993] [Fua et al., Vis 1999] [http://www.axon.com / gn_Acuity.html] [Lamping et al., CHI 1995]Difference between SciVis and InfoVis
- Card, Mackinlay, & Shneiderman:
– SciVis: Scientific, physically based – InfoVis: Abstract
- Munzner:
– SciVis: Spatial layout given – InfoVis: Spatial layout chosen
- Tory & Möller:
– SciVis: Spatial layout given + Continuous – InfoVis: Spatial layout chosen + Discrete – Everything else -- ?
Overview
- What is SciVis?
- Data & Applications
- Iso-surfaces
- Direct Volume Rendering
- Vector Visualization
- Challenges
Medical Scanning
- MRI, CT, SPECT, PET, ultrasound
Medical Scanning - Applications
- Medical education for anatomy, surgery, etc.
- Illustration of medical procedures to the patient
Medical Scanning - Applications
- Surgical simulation for treatment planning
- Tele-medicine
- Inter-operative visualization in brain surgery,
biopsies, etc.
Biological Scanning
- Scanners: Biological scanners, electronic microscopes,
confocal microscopes
- Apps – physiology, paleontology, microscopic analysis…
Industrial Scanning
- Planning (e.g., log scanning)
- Quality control
- Security (e.g. airport scanners)
Scientific Computation - Domain
- Mathematical analysis
- ODE/PDE (ordinary and partial
differential equations)
- Finite element analysis (FE)
- Supercomputer simulations
Scientific Computation - Apps
- Flow Visualization
Overview
- What is SciVis?
- Data & Applications
- Iso-surfaces
- Direct Volume Rendering
- Vector Visualization
- Challenges
Isosurfaces - Examples
Isolines Isosurfaces