outlook for oil the role of opec
play

Outlook for Oil & the Role of OPEC by Dr Maizar Rahman - PowerPoint PPT Presentation

1 Organization of the Petroleum Exporting Countries Outlook for Oil & the Role of OPEC by Dr Maizar Rahman Indonesian Governor for OPEC Acting for the Secretary General An address to the Ministry of Energy of the Philippines and


  1. 1 Organization of the Petroleum Exporting Countries Outlook for Oil & the Role of OPEC by Dr Maizar Rahman Indonesian Governor for OPEC Acting for the Secretary General An address to the Ministry of Energy of the Philippines and industry representatives Manila, Philippines, 2 December 2004

  2. 2 Real gross domestic product: 1960–2003 Real GDP in 1995 prices and exchange rates Billion US $ 35,000 30,000 25,000 OECD 20,000 15,000 10,000 DCs including China 5,000 0 1960 1970 1980 1990 2000 2003

  3. 3 GDP versus energy growth (world): 1971–2002 Total primary energy requirement (mtoe) 80000 75000 70000 65000 60000 55000 50000 45000 40000 13000 18000 23000 28000 33000 38000 Real GDP (US $ billion)

  4. 2003 Energy consumption for OECD and DCs: 1971–2003 2001 1999 1997 1995 DCs incl. China 1993 1991 FCPEs mboe/d OECD 1989 1987 1985 1983 1981 1979 1977 1975 1973 1971 250 200 150 100 50 0 4

  5. 5 OECD DCs Energy consumption by primary source: 1960–2003 10.00 12.00 14.00 16.00 18.00 20.00 10.00 15.00 20.00 25.00 30.00 35.00 40.00 0.00 2.00 4.00 6.00 8.00 0.00 5.00 DCs 1 9 6 0 1 9 7 1 1 9 7 2 1 9 6 2 1 9 7 3 1 9 6 4 1 9 7 4 1 9 7 5 1 9 6 6 1 9 7 6 1 9 6 8 1 9 7 7 1 9 7 8 1 9 7 0 1 9 7 9 1 9 7 2 1 9 8 0 1 9 8 1 Solids 1 9 7 4 1 9 8 2 1 9 7 6 1 9 8 3 1 9 8 4 1 9 7 8 Oil 1 9 8 5 1 9 8 0 1 9 8 6 Gas 1 9 8 7 1 9 8 2 1 9 8 8 OECD 1 9 8 4 1 9 8 9 Hydro 1 9 9 0 1 9 8 6 1 9 9 1 1 9 8 8 1 9 9 2 Nuclear 1 9 9 3 1 9 9 0 1 9 9 4 1 9 9 2 1 9 9 5 1 9 9 6 1 9 9 4 1 9 9 7 1 9 9 6 1 9 9 8 1 9 9 9 1 9 9 8 2 0 0 0 mboe/d 2 0 0 0 2 0 0 1 2 0 0 2 2 0 0 2 2 0 0 3

  6. 6 Appeal of petroleum Unique combination of attributes Sufficiency, accessibility, versatility, transportability Low costs in many areas Established infrastructure Ever cleaner, safer and more efficient

  7. 7 The resource base is not a constraint Cumulative production, as a percentage of the estimated resource base, has been relatively stable 4500 ? 4000 3500 3000 bn barrels 2500 2000 1500 Resource base* 1000 Cumulative production 500 0 1960 1975 1990 2005 2020 */ Source: USGC

  8. 8 OPEC crude oil Proven reserves 891 billion barrels 78.3% of world figure Production 29 million barrels a day 40.1% of world figure Cheaper to exploit than non-OPEC oil Increasing call on OPEC oil in coming years 51% world oil market projected for 2025

  9. 9 World energy mix % 2000 2010 2025 Oil 40.1 38.7 36.9 Gas 23.3 25.7 29.9 Solids 26.0 25.8 25.2 Hydro/nuclear/ 10.6 9.8 8.0 renewables OPEC World Energy Model, 2004

  10. 10 World oil production outlook in the reference case million barrels a day 2002 2010 2020 2025 Non-OPEC 47.8 54.6 56.9 56.3 OPEC (incl. NGLs) 29.2 34.1 48.9 58.3 World 77.0 88.7 105.8 114.6 OPEC market share % 37.9 38.4 46.2 50.9

  11. 11 Annual growth in oil demand: 2002 – 25 million barrels a day Asia: 65% of DCs increase, 1.2 especially China & India huge potential (e.g. low vehicle China 1.0 ownership) But possible constraints: Asia 0.8 infrastructure, policies 0.6 0.4 OECD Pac. OPEC & W. Europe 0.2 other exp. N. America Latin America. other Africa & M.E. FSU 0.0 OECD Transition DCs economies OPEC World Energy Model, 2004

  12. 12 Annual global growth in oil demand by sector million barrels of oil equivalent a day 1 0.8 0.6 0.4 0.2 0 -0.2 Transport HH/Comm Industry -0.4 Elec. Gen. -0.6 1971-1980 1990-2000 1980-1990 2000-2010 2010-2025

  13. 13 OPEC’s objectives Stable markets Reasonable prices Steady revenues Secure supply Fair returns to investors Short, medium and long terms

  14. 14 Investment in production capacity To meet increase in overall demand To replace exhausted reserves To cope with unexpected shortages Oil must be cleaner, safer and more efficient Security of demand is AS IMPORTANT AS security of supply

  15. 15 Cumulative OPEC investment requirements: effect of 1% lower world economic growth 450 If OPEC balances the market, the uncertain $258-382 billion volume requirements translate into huge 400 ranges of anticipated capital outlay needs 350 Already by 2010 an estimated uncertainty of $25 billion exists between the reference 300 $(2003) billion Reference case case and the low economic growth case 250 This a central concern: where lies the onus of maintaining sufficient spare 200 capacity? Low economic 150 growth 100 $122-173 billion 50 $70-95 billion 0 2000 2005 2010 2015 2020 2025

  16. 16 Today’s oil market OPEC concerned about high oil prices and volatility 49 49 46 46 43 43 40 40 38.6 37 2004 37 34 34 31 31 2003 28 28 25 25 Avg.'00-'03 22 22 19 19 Min-max range: 2000-03 16 16 Jan Feb Mar Apr May Jun Jul Aug Sep Oct Nov Dec Note: orange rings denote OPEC Conferences.

  17. 17 Today’s oil market Market well-supplied with crude but Higher-than-expected demand Downstream bottlenecks Geopolitical tensions Speculation

  18. 18 Increasing tightness in world refinery capacity Increasing tightness in world refinery capacity 95 90 ? 85 80 75 70 65 World refinery capacity (mb/d) World oil demand (mb/d) 60 1993 94 95 96 97 98 99 2000 01 02 03 04 05 06 07 08

  19. 19 Inter product spread (Light products prices difference vs. fuel oil) - US$/bbl 35 Regular Gasoline Unl.87 30 Gasoil (0.2% S) 25 20 15 10 5 0 Oct-03 Oct-04 Jan-03 Apr-03 Jul-03 Jan-04 Apr-04 Jul-04

  20. 20 OECD Commercial Oil Stocks (mb) 2800 2800 2700 2700 2002 2600 2600 Avg. 99-03 2500 2500 2004 2003 2400 2400 2300 2300 Jan Feb Mar Apr May Jun Jul Aug Sep Oct Nov Dec

  21. 21 
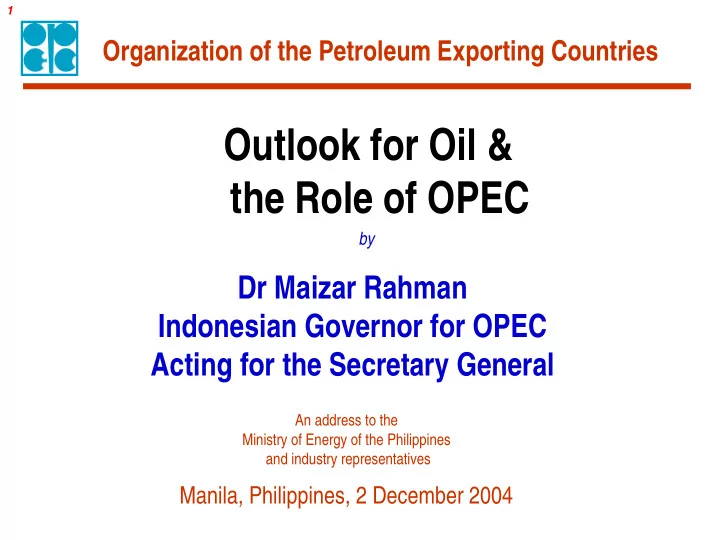
Factors in oil price movements WTI (Nymex) Rrecovery of Mexican Gulf production, increase ($/bbl) of US crude oil inventory, 60 Saudi Oil Minister's slow dow n of Chinese announcment to Oct. 22 & 26 Halt of Iraq oil increase production 55.17 export from capacities(to 11 PresidentB 55 north millionb/d) ush's Decrease of Expansion 132OPEC grow ing reelection U.S. crude oil of Iraq Winter Conf.( + 1 concerns to struggle August 19 Supply million b/d) Yukos oil Al-qaida's 48.70 50 (Sadr) concerns threat to US production 48.44 Fears of Terrorist presidential possible terro attack at al- election in US Expansion Khobar 131OPEC 45 of Iraq 46.11 June 1 Conference Nigerian struggle 42.33 (+ 2.5 million General Strike (S ) b/d) Concerns Resumption of for 42.12 40 Iraq oil export Nigerian Rebels Decrase of US Concerns for Decrease heating oil Hurricane Saudi Oil Sadr agreed of U.S. inventory in Mexican Gulf Sadr agreed Minister's press to w ithdrow crude oil grow ing to w ithdrow 35 Halt of Iraq conference, its forces 35.73 Return to 35.66 concern to its forces oil export longer halt of Decrease of April 21 June 29 from Najaf normal level 34.27 Yukos oil from Najaf Mexican Gulf U.S. crude oil of Iraq oil production oil production inventory export 30 4 4 4 4 4 4 4 4 4 4 4 4 4 4 4 4 4 4 4 4 4 4 4 4 4 4 4 4 4 4 4 4 4 4 0 0 0 0 0 0 0 0 0 0 0 0 0 0 0 0 0 0 0 0 0 0 0 0 0 0 0 0 0 0 0 0 0 0 0 0 0 0 0 0 0 0 0 0 0 0 0 0 0 0 0 0 0 0 0 0 0 0 0 0 0 0 0 0 0 0 0 0 2 2 2 2 2 2 2 2 2 2 2 2 2 2 2 2 2 2 2 2 2 2 2 2 2 2 2 2 2 2 2 2 2 2 / / / / / / / / / / / / / / / / / / / / / / / / / / / / / / / / / / 1 8 6 3 1 8 5 2 9 5 2 9 3 0 7 0 7 4 5 2 9 2 9 6 6 3 0 7 4 1 8 4 1 8 / / 1 2 2 / 1 2 2 / 1 1 2 / / 1 2 2 / 1 1 2 / / 1 2 3 / 1 2 2 / 1 1 4 4 5 6 7 7 8 9 9 0 1 / / / / / / / / / / / / / / / / / / / / / / / 4 4 4 5 5 5 6 6 6 7 7 7 8 8 8 9 9 9 1 0 0 0 1 1 1 1 1 1 1 1

  22. 22 OPEC’s production agreements * Objective: reasonable prices and stability Three-stage OPEC-10 output ceiling rise from 23.5 mb/d to: 25.5 mb/d from 1 July 26.0 mb/d from 1 August 27.0 mb/d from 1 November Total rise 3.5 mb/d *Agreements made at OPEC Conferences in Beirut on 3 June and Vienna on 15 September

  23. 23 OPEC crude oil production and capacity 36 34 max 32 Capacity min 30 Production 28 26 */ The production ranges for '04 & '05 are based on required OPEC crude production for the balance from the survey of forecasts. 24 1998 1999 2000 2001 2002 2003 200 04* 2005*

  24. 24 Dialogue and cooperation Big advances in recent years The industry is much better off if there is an underlying consensus on such major issues as price stability, security, investment, the environment and sustainable development

  25. 25 Rising to the challenges Globalisation Technology Environment Sustainable development

  26. Thank You 26

Download Presentation
Download Policy: The content available on the website is offered to you 'AS IS' for your personal information and use only. It cannot be commercialized, licensed, or distributed on other websites without prior consent from the author. To download a presentation, simply click this link. If you encounter any difficulties during the download process, it's possible that the publisher has removed the file from their server.

Recommend


More recommend