
SLIDE 1
1
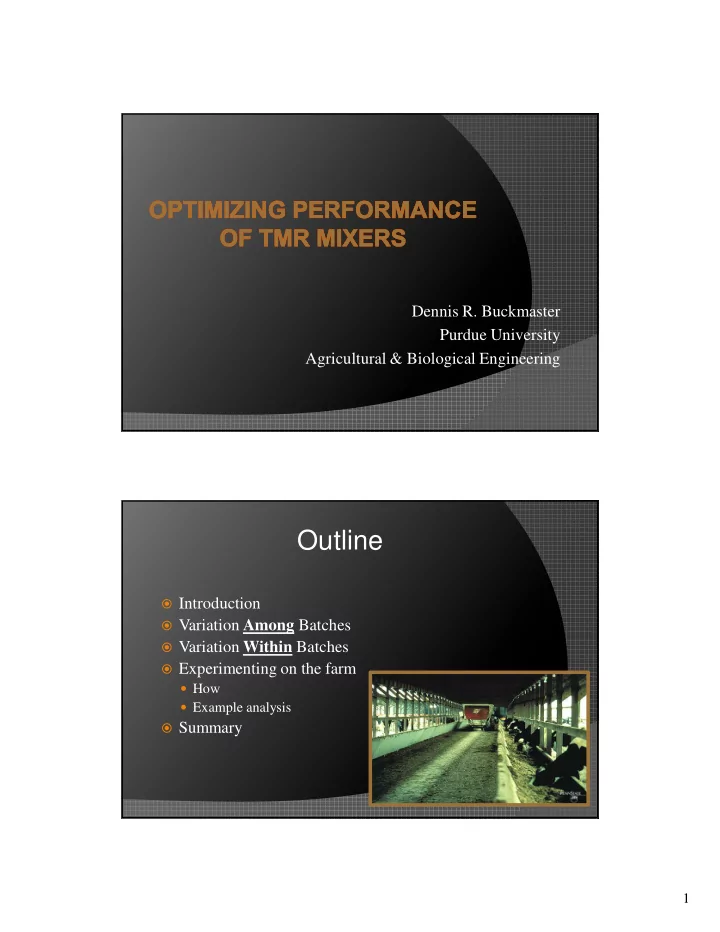
Dennis R. Buckmaster Purdue University Agricultural & Biological Engineering
Outline
Introduction Variation Among Batches Variation Within Batches Experimenting on the farm How Example analysis Summary
Outline Introduction Variation Among Batches Variation Within - - PDF document
Dennis R. Buckmaster Purdue University Agricultural & Biological Engineering Outline Introduction Variation Among Batches Variation Within Batches Experimenting on the farm How Example analysis Summary 1 Goals of
1
Introduction Variation Among Batches Variation Within Batches Experimenting on the farm How Example analysis Summary
2
Consistent blend in the feed bunk
across location despite feedstuff changes Proper particle size Low labor & equipment cost Long equipment life & low
Describe the animals Characterize the feeds Balance the ration Deliver the ration
3
Describe the animals Characterize the feeds Balance the ration Deliver the ration Monitor the ration
TMR MTR MPR PMTR TMTR
4
TMR
MTR
MPR
PMTR
TMTR
5
6
In a ration with 5 ingredients, there are 15 reasons
DM content (%) Nutrient concentration (% of DM) Amount in the mix (lb as is)
feeds fraction lb feeds fraction lb ration
% % ,
7
Monitor ingredient nutrient concentrations ingredient DM concentrations particle size reduction Control amounts in the ration mixing protocol (fill order & mixing time)
EXAMPLE 1 Ration with:
○ haycrop silage ○ corn silage ○ grain premix
Haycrop silage moisture goes up (a 5 to 10 percentage
8
EXAMPLE 1 (haycrop moisture increases) Consequences if no corrective action is taken
○ less haycrop DM in ration ○ lower protein in the ration ○ higher energy concentration in the ration ○ likely reduced effective fiber in the ration ○ more grain consumption than planned
Corrective action: adjust amounts in the ration
EXAMPLE 2 Ration with:
○ haycrop silage ○ corn silage ○ grain premix
Corn silage amount swings widely from batch to batch
9
EXAMPLE 2 (corn silage amount varies) Consequences if no corrective action is taken
○ inconsistent energy concentration in the ration ○ inconsistent protein concentration in the ration ○ inconsistent effective fiber in the ration ○ intake is inconsistent and likely decreases
Corrective action: meter in more consistently or vary
EXAMPLE 3
haycrop silage grain premix corn silage corn silage grain premix haycrop silage
10
EXAMPLE 3 (varied fill order) Consequences if no corrective action is taken
○ inconsistent particle size distribution in the ration ○ inconsistent effective fiber in the ration
Corrective action: Implement a consistent mixing
Mixer capacity select for minimum batch size select for maximum batch size Mixer management fill order mixing time particle size reduction
11
Size for maximum batch size Size for minimum batch size Maybe not all groups get the same number of
Most mixers don’t work well when “full” (likely 70% full
Mix long enough (assure uniformity) Don’t mix too long (avoid excessive wear, particle
Control particle size reduction Understand the material flow in the mixer
12
Mixer off during loading Small quantity and liquid ingredients loaded in
Haycrop silage loaded last Mix 3-5 minutes after filling is complete Unload quickly, mixer off except when unloading
13
DM content microwave, Koster tester, vortex dryer,
Particle size distribution Penn State separator or lab analysis Nutrient concentrations Lab analysis Tracers in the ration
Replicate, replicate, replicate Change one thing at a time Be consistent and document what you are doing Use appropriate (likely simple) statistics Ask for advice when you should
14
change fill order change mixing time (count revolutions instead of time) try not running the mixer during filling & transport (or
corn hay silage 1 silage 2 premix
Add a tracer such as whole shelled corn, cotton seeds,
Take samples from the bunk for lab analysis
15
“mix” a single forage (vary time and monitor particle
hand mix a mini-ration as a comparison compute weighted average particle size distribution
Penn State separator Laboratory analysis
16
15 lb of whole shelled corn was added for each ton
2 lb samples were pulled along the feed bunk Kernel counts per 2 lb sample is reported.
17
Five similar replicate batches Same mixer Same ingredients from the same structures Same fill order Same mixer operation and procedure 2 lb samples pulled from bunk Hay was a significant part of the ration % long particles (top sieve of PSU separator)
% long material CV of % long material Confidence interval of CV of % long material
18
19
Previous example Same mixer, new procedure
Previous example Same mixer, new procedure
20
Errors in print
21
25 samples, 5 each from 5 batches With this limited data, a very slight change in any one
Batch CV averages
With 5 samples from each of 10 batches (2x the work), p=.007
Average of meals 7.8 in both cases
CV of meals 18.3 vs. 25.6
Even so, if procedure 2 “didn’t cost anything” …
22