
Outline
Infering Graphical Models from Time Series
Modelling, Simulating, and Inference of Complex Biological Systems
Speaker: Sebastian Petry
Institut of Statistics Ludwig-Maximilians-University Munich
07-14-06
Sebastian Petry Infering Graphical Models from Time Series Outline
Outline
1
What are Graphical Models?
2
Graph Theory Graphs and Digraphs Dags
3
Probability Theory Association Structures Partial Covariance as a Graphical Model Multivariate Time Series and Stochastic Processes Independence of Time Series
4
Infering Grapical Models from Time Series
5
Summary
Sebastian Petry Infering Graphical Models from Time Series What are Graphical Models? Graph Theory Probability Theory Infering Grapical Models from Time Series Summary
Graphical Models
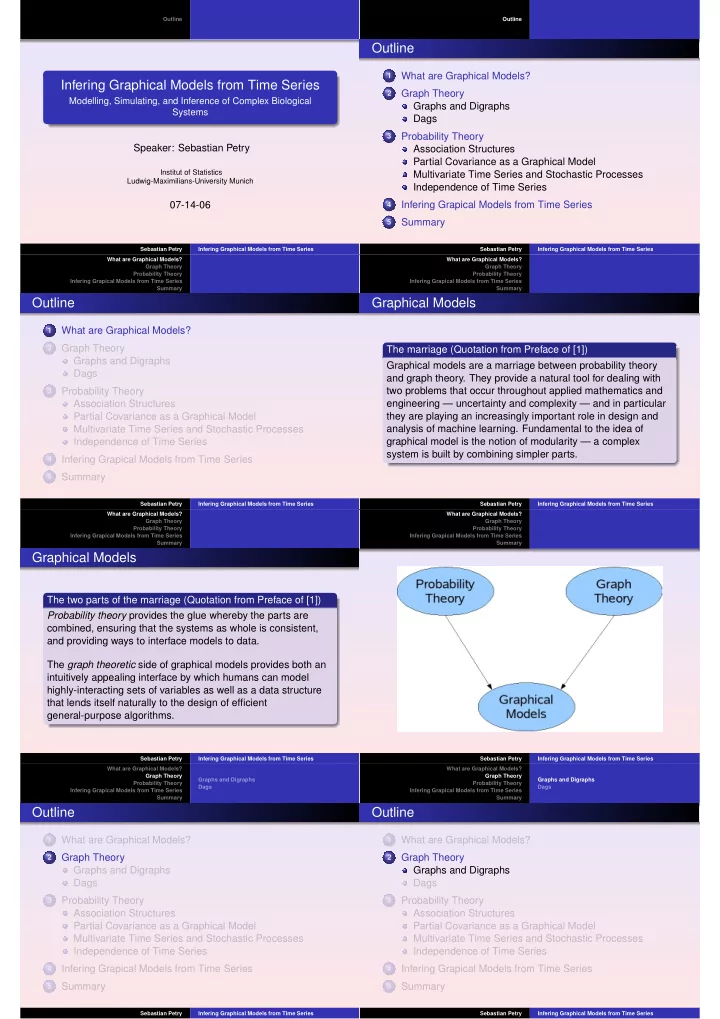
The marriage (Quotation from Preface of [1]) Graphical models are a marriage between probability theory and graph theory. They provide a natural tool for dealing with two problems that occur throughout applied mathematics and engineering — uncertainty and complexity — and in particular they are playing an increasingly important role in design and analysis of machine learning. Fundamental to the idea of graphical model is the notion of modularity — a complex system is built by combining simpler parts.
Sebastian Petry Infering Graphical Models from Time Series What are Graphical Models? Graph Theory Probability Theory Infering Grapical Models from Time Series Summary
Graphical Models
The two parts of the marriage (Quotation from Preface of [1]) Probability theory provides the glue whereby the parts are combined, ensuring that the systems as whole is consistent, and providing ways to interface models to data. The graph theoretic side of graphical models provides both an intuitively appealing interface by which humans can model highly-interacting sets of variables as well as a data structure that lends itself naturally to the design of efficient general-purpose algorithms.
Sebastian Petry Infering Graphical Models from Time Series What are Graphical Models? Graph Theory Probability Theory Infering Grapical Models from Time Series Summary Sebastian Petry Infering Graphical Models from Time Series What are Graphical Models? Graph Theory Probability Theory Infering Grapical Models from Time Series Summary Graphs and Digraphs Dags
Outline
1
What are Graphical Models?
2
Graph Theory Graphs and Digraphs Dags
3
Probability Theory Association Structures Partial Covariance as a Graphical Model Multivariate Time Series and Stochastic Processes Independence of Time Series
4
Infering Grapical Models from Time Series
5
Summary
Sebastian Petry Infering Graphical Models from Time Series What are Graphical Models? Graph Theory Probability Theory Infering Grapical Models from Time Series Summary Graphs and Digraphs Dags
Outline
1
What are Graphical Models?
2
Graph Theory Graphs and Digraphs Dags
3
Probability Theory Association Structures Partial Covariance as a Graphical Model Multivariate Time Series and Stochastic Processes Independence of Time Series
4
Infering Grapical Models from Time Series
5
Summary
Sebastian Petry Infering Graphical Models from Time Series