outline outline
play

Outline Outline International Trade week 17 International trading - PowerPoint PPT Presentation

Outline Outline International Trade week 17 International trading patterns April 30 th Why do countries trade? Why do countries trade? Comparative advantage Readings: Sources of comparative advantage Sources of


  1. Outline Outline International Trade – week 17  International trading patterns April 30 th  Why do countries trade?  Why do countries trade?  Comparative advantage Readings:  Sources of comparative advantage  Sources of comparative advantage Ray chapter 16 Ray chapter 16 1 2 
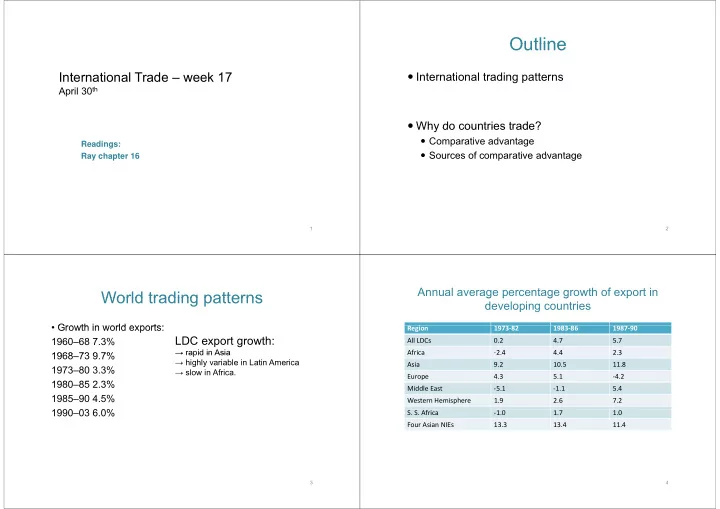
Annual average percentage growth of export in g p g g p World trading patterns World trading patterns developing countries • Growth in world exports: Growth in world exports: Region i 1973 ‐ 82 1983 ‐ 86 1987 ‐ 90 LDC export growth: 1960–68 7.3% All LDCs 0.2 4.7 5.7 → rapid in Asia → rapid in Asia Africa Africa ‐ 2 4 2.4 4.4 4 4 2.3 2 3 1968–73 9.7% 1968 73 9 7% → highly variable in Latin America Asia 9.2 10.5 11.8 1973–80 3.3% → slow in Africa. Europe 4.3 5.1 ‐ 4.2 1980–85 2.3% 1980 85 2 3% Middle East ‐ 5.1 ‐ 1.1 5.4 1985–90 4.5% Western Hemisphere 1.9 2.6 7.2 1990–03 6.0% 1990 03 6 0% S. S. Africa ‐ 1.0 1.7 1.0 Four Asian NIEs 13.3 13.4 11.4 3 4

  2. World trading patterns World trading patterns Trends in the share of LDC manufactured exports Trends in the share of LDC manufactured exports Region i 1970 1975 1980 1985 1990 • The composition of exports from developing Share in world total All LDCs All LDCs 7.0 7 0 7 4 7.4 10.0 10 0 13.3 13 3 17.1 17 1 countries has significantly shifted toward t i h i ifi tl hift d t d Asia 3.7 4.7 7.2 9.5 14.1 manufactured exports. Latin America 1.8 1.7 2.0 2.5 2.0 Africa 1.4 0.7 0.6 0.4 0.5 • And the share of developed economies in p Share in LDC total Asia 52.4 62.8 71.8 71.2 82.7 manufactured export has declined. Latin America 26.2 23.4 20.3 18.5 11.6 Africa Africa 19 5 19.5 9.3 9 3 5 8 5.8 3 2 3.2 2 8 2.8 5 6 Export shares (%) by product category from developed • Standard hypothesis of trade patterns: • Standard hypothesis of trade patterns: countries to other developed and developing countries Product category Product category DCs DCs LDCs LDCs Fuels, minerals, metals 8 5 Other primaries 12 11 Chemicals ans related 39 35 • LDCs export proportionately more primary goods Manufactures 41 48 • BUT developed countries do not import BUT developed countries do not import proportionately more primary goods • DCs export approximately the same composition of products to other DCc as they do to LDCs. other DCc as they do to LDCs. • Why ? • The value of trade within the group of DCs has consistently → large fraction of DC trade is within DCs and is in → large fraction of DC trade is within DCs and is in exceeded the value of trade between developed and developing manufactured goods countries. 7 8

  3. Why Do Countries Trade? Comparative advantage Comparative advantage Comparative advantage • Imagine there are only two countries in the world I i th l t t i i th ld Labor required One computer One sack of rice economy, North (N) and South (S). In N 10 15 In S In S 40 40 20 20 • Only two commodities are produced: computers and • The table describes how many units of labor are required to make one computer and one sack of rice one computer and one sack of rice. rice. i • S is more inefficient (relative to N) in the production of computers as ( ) p p • We suppose that labor is the only factor of well as rice, yet we are going to show that the countries will prefer to trade with each other. production. • Both N and S are blessed with a total of 600 units of labor 9 10 Production possiblity frontiers Production possiblity frontiers • Suppose that the two countries are barred from trading with each other, they will each have to produce all their domestic demands for rice and computers. • If both goods are consumed in North: N rice 10 10 2 2 p p   rice C C N 15 3 p R Why? Country North Country South   40 N 10 and N 15 p p w w C R C R 30 N N N 10 p p p     If C R C , then w w C R 10 10 15 15 N 15 15 p p R R • All workers flow into computers. computers p 60 60 15 15 computers computers 11 12

  4. Free Trade Free Trade N N N p p p 10     C R C , then w w If C R • If both goods are going to be produced: 10 15 N 15 p R All workers flow into rice. 2/3 < p c /p R < 2 p c p R C  For both goods to be produced, we need w w R • Why? y • If p c /p R < 2/3 <2, both countries specialize in rice p c p R , p Similarly, if both goods are consumed in South: Si il l if b th d d i S th • If p c /p R >2 >2/3, both countries specialize in computers S p 40   C 2 2 S 20 p • If 2/3 < p c /p R < 2 North specializes in computers and R South in rice 13 14 • If it is cheaper to produce rice in North, If it is cheaper to produce rice in North • The international relative price settles somewhere why don’t people by rice there? between the two autarkic price ratios. • Country N will produce only computers. Computers in – Market wages adjust so that rice is not cheaper in Market wages adjust so that rice is not cheaper in North can now be transformed into rice via a better North can now be ”transformed” into rice via a better North, even though less labor is required. ”possibility frontier” than the country had at its disposal under autarky. under autarky. – Because labor in the technologically advanced country produces more, it must be paid a higher • Because the relative international price of computers is Because the relative international price of computers is wage. less than the autarkic ratio of 2, this permits higher consumption of both goods in country N than under autarky. • This effectively nullifies N’s advantage in rice production rice production 15 16

  5. Gains from trade Gains from trade Comparative advantage Comparative advantage • This simple story is based on David Ricardo’s theory of comparative advantage and is often called the Ricardian model. • A country has an comparative advantage in the production of a good if the relative cost of producing a good (relative to of a good if the relative cost of producing a good (relative to the cost of producing other goods) is lower in this country than in another country. • Comparatively speaking, country S is better at producing rice than country N, although N is absolutely better at producing rice. 17 18 Comparative advantage Comparative advantage • Predicions of Ricardian Theory • Predicions of Ricardian Theory Each country specializes in the production of the goods in • All that matter for determining the trade pattern in this t at atte o dete g t e t ade patte t s which it has a comparative advantage and export them in which it has a comparative advantage and export them in simple example, is the relative costs of producing return for other goods. computers and rice in each country. • All households in both countries are unambiguously better off with free trade than in autarky • The absolute cost of production turns out to be irrelevant – The wage in both countries rises The age in both co ntries rises for the trade pattern. – Consumption possibilities lie outside the production possibilities frontier. • Unless the relative costs of production in the two • Caveats countries turn out to be exactly the same, there is always – Only one factor of production scope for profitable trade by both countries scope for profitable trade by both countries. – Labor is perfectly mobile across sectors L b i f tl bil t – Competitive markets 19 20

  6. Comparative advantage Comparative advantage Sources of comparative advantage Sources of comparative advantage A country has a comparative advantage in the A country has a comparative advantage in the 1. Technology production of a particular commodity if it can domestically ”transform” other commodities into domestically transform other commodities into this commodity more easily than other countries can can. 2 2. Factor endowments Factor endowments The fact that a country may have an absolute Th f t th t t h b l t advantage in the production of all commodities 3. Preferences ( (or none) is irrelevant in this context. ) i i l t i thi t t 21 22 Sources of comparative advantage Sources of comparative advantage Sources of comparative advantage Sources of comparative advantage 1 Technology 1. Technology 2. Factor endowments 2 Factor endowments An important source of comparative advantage is that a • One of the most important determinants of comparative • One of the most important determinants of comparative country may have a relative technological advantage in h l i h l i l d i advantage is the endowment of factors. the production of some good(s). In the example, the technical know-how is assumed to differ across technical know-how is assumed to differ across countries. • Given that endowment differ substantially between countries, it is hardly surprising that even if two countries , y p g have identical technologies as well as identical Technological differences form an important component preferences, they might find it profitable to trade with of comparative advantage, but there are other p g , each other. h h determinants as well. 23 24

Download Presentation
Download Policy: The content available on the website is offered to you 'AS IS' for your personal information and use only. It cannot be commercialized, licensed, or distributed on other websites without prior consent from the author. To download a presentation, simply click this link. If you encounter any difficulties during the download process, it's possible that the publisher has removed the file from their server.

Recommend


More recommend