
SLIDE 1
1 1
Differential Congestion Notification: Differential Congestion Notification: Taming the Elephants Taming the Elephants
Long Le, Jay Aikat, Kevin Jeffay, and Don Smith Long Le, Jay Aikat, Kevin Jeffay, and Don Smith The The UNIVERSITY UNIVERSITY of
- f NORTH CAROLINA
NORTH CAROLINA at at CHAPEL HILL CHAPEL HILL
http://www.cs.unc.edu/Research/dirt
IEEE ICNP 2004 IEEE ICNP 2004
2 2
Outline Outline
- Background: Router-based congestion control
Background: Router-based congestion control
– – Active Queue Management (AQM) Active Queue Management (AQM) – – Explicit Congestion Notification (ECN) Explicit Congestion Notification (ECN)
- Do AQM schemes work?
Do AQM schemes work?
- The case for
The case for differential congestion notification differential congestion notification (DCN) (DCN)
- A DCN prototype and its empirical evaluation
A DCN prototype and its empirical evaluation
3 3
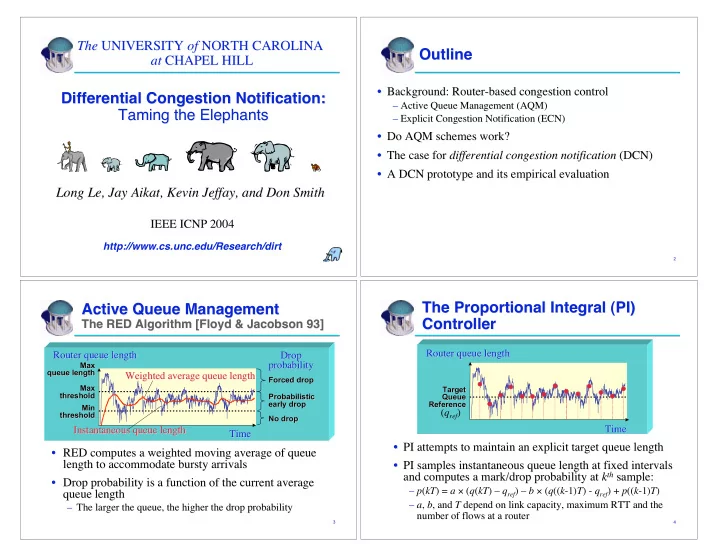
Active Queue Management Active Queue Management
The RED Algorithm [Floyd & Jacobson 93] The RED Algorithm [Floyd & Jacobson 93]
Time Time
Max Max queue length queue length Min Min threshold threshold
Drop Drop probability probability
No drop No drop Max Max threshold threshold Forced drop Forced drop Probabilistic Probabilistic early drop early drop
Router queue length Router queue length Weighted average queue length Weighted average queue length
- RED computes a weighted moving average of queue
RED computes a weighted moving average of queue length to accommodate length to accommodate bursty bursty arrivals arrivals
- Drop probability is a function of the current average
Drop probability is a function of the current average queue length queue length
– – The larger the queue, the higher the drop probability The larger the queue, the higher the drop probability Instantaneous queue length Instantaneous queue length
4 4
The Proportional Integral (PI) The Proportional Integral (PI) Controller Controller
- PI attempts to maintain an explicit target queue length
PI attempts to maintain an explicit target queue length
Time Time Router queue length Router queue length
- PI samples instantaneous queue length at fixed intervals