Outline Outline Review of PSP Levels Overview Resource planning - - PDF document

outline outline
SMART_READER_LITE
LIVE PREVIEW

Outline Outline Review of PSP Levels Overview Resource planning - - PDF document

Outline Outline Review of PSP Levels Overview Resource planning Planning IV: Planning IV: Estimating development and task time Combining multiple estimates Resource & Schedule Estimating Resource & Schedule Estimating Multiple


slide-1
SLIDE 1

1

AU INSY 560, Winter 1997, Dan Turk AU INSY 560, Winter 1997, Dan Turk Humphrey Ch. 6 - slide Humphrey Ch. 6 - slide 1 1

Planning IV: Resource & Schedule Estimating Planning IV: Resource & Schedule Estimating

AU INSY 560, Winter 1997, Dan Turk AU INSY 560, Winter 1997, Dan Turk Humphrey Ch. 6 - slide Humphrey Ch. 6 - slide 2 2

Outline Outline

Review of PSP Levels Overview Resource planning Estimating development and task time Combining multiple estimates Multiple regression Schedule estimating Earned value tracking Estimating accuracy Homework #5

AU INSY 560, Winter 1997, Dan Turk AU INSY 560, Winter 1997, Dan Turk Humphrey Ch. 6 - slide Humphrey Ch. 6 - slide 3 3

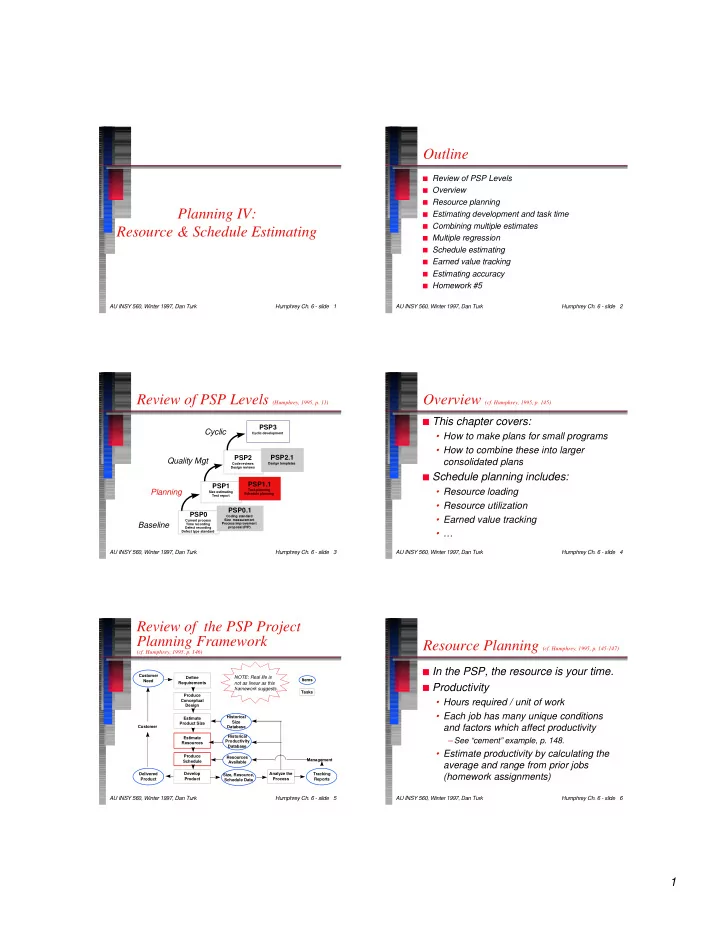
Review of PSP Levels (Humphrey, 1995, p. 11) Review of PSP Levels (Humphrey, 1995, p. 11)

PSP0

Current process Time recording Defect recording Defect type standard

PSP1

Size estimating Test report

PSP2

Code reviews Design reviews

PSP3

Cyclic development

PSP2.1

Design templates

PSP1.1

Task planning Schedule planning

PSP0.1

Coding standard Size measurement Process improvement proposal (PIP)

Baseline Planning Quality Mgt Cyclic

AU INSY 560, Winter 1997, Dan Turk AU INSY 560, Winter 1997, Dan Turk Humphrey Ch. 6 - slide Humphrey Ch. 6 - slide 4 4

Overview (cf. Humphrey, 1995, p. 145) Overview (cf. Humphrey, 1995, p. 145)

This chapter covers:

  • How to make plans for small programs
  • How to combine these into larger

consolidated plans

Schedule planning includes:

  • Resource loading
  • Resource utilization
  • Earned value tracking

AU INSY 560, Winter 1997, Dan Turk AU INSY 560, Winter 1997, Dan Turk Humphrey Ch. 6 - slide Humphrey Ch. 6 - slide 5 5

Review of the PSP Project Planning Framework

(cf. Humphrey, 1995, p. 146)

Review of the PSP Project Planning Framework

(cf. Humphrey, 1995, p. 146)

Define Requirements Produce Conceptual Design Estimate Product Size Estimate Resources Produce Schedule Develop Product Analyze the Process Resources Available Historical Productivity Database Historical Size Database Tracking Reports Customer Need Delivered Product Management Customer Items Tasks Size, Resource, Schedule Data NOTE: Real life is NOTE: Real life is not as linear as this not as linear as this framework suggests. framework suggests.

AU INSY 560, Winter 1997, Dan Turk AU INSY 560, Winter 1997, Dan Turk Humphrey Ch. 6 - slide Humphrey Ch. 6 - slide 6 6

Resource Planning (cf. Humphrey, 1995, p. 145-147) Resource Planning (cf. Humphrey, 1995, p. 145-147)

In the PSP, the resource is your time. Productivity

  • Hours required / unit of work
  • Each job has many unique conditions

and factors which affect productivity

– See “cement” example, p. 148.

  • Estimate productivity by calculating the

average and range from prior jobs (homework assignments)

slide-2
SLIDE 2

2

AU INSY 560, Winter 1997, Dan Turk AU INSY 560, Winter 1997, Dan Turk Humphrey Ch. 6 - slide Humphrey Ch. 6 - slide 7 7

Estimating Task Time

(cf. Humphrey, 1995, p. 145)

Estimating Task Time

(cf. Humphrey, 1995, p. 145)

The SW development task is a special instance of general tasks for which time estimates must be made.

  • See Fig. 6.3, p. 156, and general task-estimation steps.

For SW development we prefer to base our estimates on historical data. We have three types of historical data which may be used:

  • A: Estimated object LOC & total actual development

hours

  • B: Actual object LOC & total actual development hours
  • C: Actual total new/changed LOC & total actual

development hours

AU INSY 560, Winter 1997, Dan Turk AU INSY 560, Winter 1997, Dan Turk Humphrey Ch. 6 - slide Humphrey Ch. 6 - slide 8 8

Development Time Planning Process ( Humphrey, 1995, p. 149) Development Time Planning Process ( Humphrey, 1995, p. 149)

Obtain historical data Are there sufficient data for a regression calculation? Calculate historical productivity in actual new & changed LOC per hour Calculate the hours required Calculate the shortest and longest likely times Are there sufficient estimate data for a regression calculation? Do the regression calculation on actual

  • bject LOC

and actual hours Calculate the time required Calculate the prediction interval Do the regression calculation on estimated

  • bject LOC and actual

hours Calculate the time required Calculate the prediction intervals LOC Size Estimate No Yes No Yes Time Estimate Time Estimate Time Estimate

Estimating Choice C Estimating Choice B Estimating Choice A

Walk through Walk through diagram and diagram and steps, p. 148-153. steps, p. 148-153. AU INSY 560, Winter 1997, Dan Turk AU INSY 560, Winter 1997, Dan Turk Humphrey Ch. 6 - slide Humphrey Ch. 6 - slide 9 9

Development Time Planning Example ( Humphrey, 1995, p. 149) Development Time Planning Example ( Humphrey, 1995, p. 149)

Walk through example on p. 153-155 See how regression parameters are calculated and used.

AU INSY 560, Winter 1997, Dan Turk AU INSY 560, Winter 1997, Dan Turk Humphrey Ch. 6 - slide Humphrey Ch. 6 - slide 10 10

Combining Multiple Estimates

(cf. Humphrey, 1995, p. 158-163)

Combining Multiple Estimates

(cf. Humphrey, 1995, p. 158-163)

Assume 4 estimates: a, b, c, d. The estimated hours and standard deviations are:

  • Ha, Hb, Hc, Hd and σa, σb, σc, σd

When estimates are independent (e.g. come from separate databases) and unbiased (not all from same project, under same manager, etc.):

  • Ht = total hourly time = Σ Hi
  • σt = total standard deviation = sqrt( Σ σi)
  • Hupper = Ht + σt
  • Hlower = Ht - σt

AU INSY 560, Winter 1997, Dan Turk AU INSY 560, Winter 1997, Dan Turk Humphrey Ch. 6 - slide Humphrey Ch. 6 - slide 11 11

Combining Multiple Estimates Under Dependence (cf. Humphrey, 1995, p. 158-163) Combining Multiple Estimates Under Dependence (cf. Humphrey, 1995, p. 158-163)

Must use more involved calculation for the prediction interval when estimates to be combined are not statistically independent Use formulas on p. 160-162

AU INSY 560, Winter 1997, Dan Turk AU INSY 560, Winter 1997, Dan Turk Humphrey Ch. 6 - slide Humphrey Ch. 6 - slide 12 12

Multiple Regression

(cf. Humphrey, 1995, p. 162-166)

Multiple Regression

(cf. Humphrey, 1995, p. 162-166)

The problem:

  • We don’t have detailed enough data.
  • e.g. We have total hours, new LOC, reused

LOC, & modified LOC, but not hours by each of these LOC categories.

The solution:

  • Multiple regression estimates the relative

contributions.

Example regression equation:

  • Hourst = βo + β1Newk + β2Reusek + β3Modifiedk
slide-3
SLIDE 3

3

AU INSY 560, Winter 1997, Dan Turk AU INSY 560, Winter 1997, Dan Turk Humphrey Ch. 6 - slide Humphrey Ch. 6 - slide 13 13

Multiple Regression (cont.)

(cf. Humphrey, 1995, p. 162-168)

Multiple Regression (cont.)

(cf. Humphrey, 1995, p. 162-168)

Gauss’s method is used to solve the simultaneous equations (cf. p. 560-564 for an example). The resulting equation is:

  • Hours = 6.71 + 0.0784*650 + 0.0150*3000 + 0.2461*155

= 141

  • βo = 6.71 hours overhead
  • β1 = 0.0784 hrs to develop a new LOC (12.76 LOC / hr)
  • β2 = 0.0150 hrs to reuse a LOC (66.48 LOC / hr)
  • β3 = 0.2461 hrs to modify a LOC 4.06 LOC / hr)

The prediction interval calculation and formulas are shown on p. 166-168. Caution: Use regression with care. Don’t apply formula outside database limits.

AU INSY 560, Winter 1997, Dan Turk AU INSY 560, Winter 1997, Dan Turk Humphrey Ch. 6 - slide Humphrey Ch. 6 - slide 14 14

Schedule Estimating: Overview

(cf. Humphrey, 1995, p. 168-170)

Schedule Estimating: Overview

(cf. Humphrey, 1995, p. 168-170)

Even with good estimates, if you make incorrect assumptions about daily / weekly available time, schedules can be seriously in error. Only time available for direct work can be used to set a schedule. Many other activities demand your time: vacation, sick, mail, committees, etc. Over time you should gather data on how you use your time,

  • nly then can you make good schedules.
  • Planning using this “unplanned time cushion” gives you some

“slack” and room for adjustment for “crunch” times in your schedule. Typically only 50-75% of time can be spent on direct work. AU INSY 560, Winter 1997, Dan Turk AU INSY 560, Winter 1997, Dan Turk Humphrey Ch. 6 - slide Humphrey Ch. 6 - slide 15 15

Schedule Estimating: The PSP Schedule Planning Procedure

(cf. Humphrey, 1995, p. 170-180)

Schedule Estimating: The PSP Schedule Planning Procedure

(cf. Humphrey, 1995, p. 170-180)

The procedure is documented by:

  • Fig 6.4: PSP Schedule Planning Diagram
  • Table 6.11 & 12: Schedule Planning Template & Example
  • Table 6.13 & 14: Task Planning Template & Example

NOTE:

  • This is presented in a very TOP-DOWN approach, as opposed

to a BOTTOM-UP approach which is commonly used in activity- based planning (cf. MGT 882). Look at and talk about Fig. 6.4, p. 171 Walk through step-by-step sequence, & forms Discuss relationship of this method to project networks, activity-based planning, etc.

  • Show equivalent network for Humphrey’s task plan
  • Demonstrate project management software.

AU INSY 560, Winter 1997, Dan Turk AU INSY 560, Winter 1997, Dan Turk Humphrey Ch. 6 - slide Humphrey Ch. 6 - slide 16 16

Earned Value: Definition

(cf. Humphrey, 1995, p. 180-182)

Earned Value: Definition

(cf. Humphrey, 1995, p. 180-182)

“Earned value (EV) is a way to evaluate project progress. It establishes a relative value for every task and credits that value when [the task is complete].” EV allows progress to be tracked on different types of activities, and even when planned sequencing is changed, or tasks are added or deleted. EV = Percent based on proportion of total project.

AU INSY 560, Winter 1997, Dan Turk AU INSY 560, Winter 1997, Dan Turk Humphrey Ch. 6 - slide Humphrey Ch. 6 - slide 17 17

Earned Value (cont.)

(cf. Humphrey, 1995, p. 180-182)

Earned Value (cont.)

(cf. Humphrey, 1995, p. 180-182)

EV is credited only when a task is completed.

  • No partial credit is given.
  • If tasks are large enough that intermediate tracking is

desired, break them down and assign EV’s to all sub- tasks.

Question: What are some examples of small and large ISD/SE tasks? Set checkpoints based on total project size.

  • Over 2-3 weeks, 10 checks is too much
  • Humphrey:

> 1 per week, < 1 per day 2-4 per week AU INSY 560, Winter 1997, Dan Turk AU INSY 560, Winter 1997, Dan Turk Humphrey Ch. 6 - slide Humphrey Ch. 6 - slide 18 18

EV Tracking Example

(cf. Humphrey, 1995, p. 182-195)

EV Tracking Example

(cf. Humphrey, 1995, p. 182-195)

Walk through:

  • Tables 6.15 & 16 - Task & Schedule

Plans

  • Tables 6.17 & 18 - Actual
  • Table 6.19 - Adjusted schedule

(additional task added to original schedule)

Finished on time even with all the changes.

slide-4
SLIDE 4

4

AU INSY 560, Winter 1997, Dan Turk AU INSY 560, Winter 1997, Dan Turk Humphrey Ch. 6 - slide Humphrey Ch. 6 - slide 19 19

EV Conclusions

(cf. Humphrey, 1995, p. 195-196)

EV Conclusions

(cf. Humphrey, 1995, p. 195-196)

Get management help for problems and alert them to changes. EV & motivation

  • It is hard to maintain motivation when

working on activities which have no EV.

  • Therefore, promptly put new activities

into your plan, and

  • Promptly drop activities.
  • Remember, you are in charge, and the

plan is there to help you.

AU INSY 560, Winter 1997, Dan Turk AU INSY 560, Winter 1997, Dan Turk Humphrey Ch. 6 - slide Humphrey Ch. 6 - slide 20 20

Estimating Accuracy

(cf. Humphrey, 1995, p. 196-204)

Estimating Accuracy

(cf. Humphrey, 1995, p. 196-204)

Estimation is difficult. Over- and under-estimation should balance out. Error% = 100 * (Act - Est) / Est Note student and class results in Fig’s 6.6-13 on p. 197-201.

  • Over- and under-estimation
  • Improvement for some
  • Bad estimate after good ones.

DON’T OVERCOMPENSATE Learning time depends on each person

AU INSY 560, Winter 1997, Dan Turk AU INSY 560, Winter 1997, Dan Turk Humphrey Ch. 6 - slide Humphrey Ch. 6 - slide 21 21

Estimating Accuracy (cont.)

(cf. Humphrey, 1995, p. 202-204)

Estimating Accuracy (cont.)

(cf. Humphrey, 1995, p. 202-204)

Small estimates

  • Small tasks have lots of variation.
  • To improve estimation, try to understand as

many causes as possible.

  • Do this with consistent planning, using historical

data, and planning in detail.

Composite estimates

  • Composites are more reliable
  • Estimates are difficult when using evolving

process data

AU INSY 560, Winter 1997, Dan Turk AU INSY 560, Winter 1997, Dan Turk Humphrey Ch. 6 - slide Humphrey Ch. 6 - slide 22 22

Estimating Accuracy (cont.)

(cf. Humphrey, 1995, p. 202-204)

Estimating Accuracy (cont.)

(cf. Humphrey, 1995, p. 202-204)

Overcompensation

  • Don’t estimate to “average” - you’ll always be
  • ff
  • Don’t adjust your intuition
  • Get feedback from colleagues

Reasonableness

  • Is the estimate reasonable?
  • Strange β weights can be caused by:

– Closely-clustered historical data – Estimating above and below the historical data range – Including outliers

AU INSY 560, Winter 1997, Dan Turk AU INSY 560, Winter 1997, Dan Turk Humphrey Ch. 6 - slide Humphrey Ch. 6 - slide 23 23

Homework #5 Homework #5

Program 5A

  • Integration via Simpson’s rule
  • See p. 755-757, and Assignment Kit #5