Outcome Based Budgeting for Beginners Kathy Makens @kmakens - - PowerPoint PPT Presentation
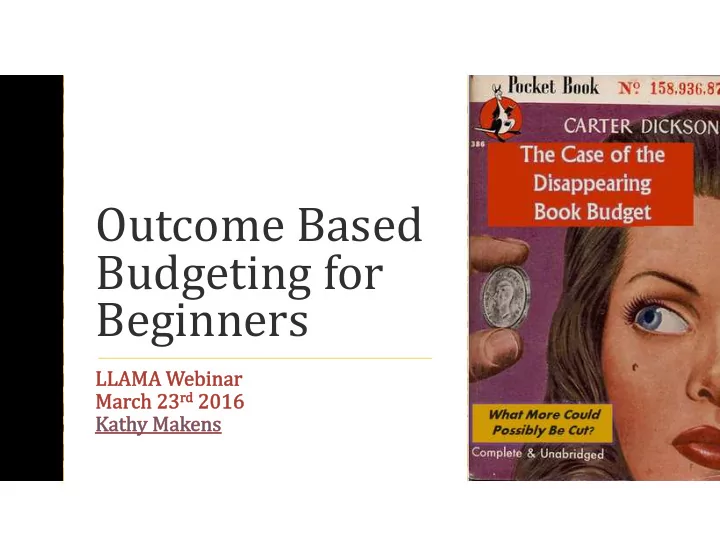
Outcome Based Budgeting for Beginners Kathy Makens @kmakens kmakens@dconc.gov Resources and Finance Officer for Durham County Library Oversee budget of $11 million plus Supervise Library IT, Technical Services, Finance, and Archives
Kathy Makens
@kmakens kmakens@dconc.gov Resources and Finance Officer for Durham County Library
Oversee budget of $11 million plus Supervise Library IT, Technical Services, Finance, and Archives divisions Service population around 288,000
How Did Your Budget Fare This Fiscal Year? Increased Decreased Stayed Flat or Close to Flat
What We Will Cover
Common Mistakes What Works Using Data to Make Your Case
Common Problems
Not tailoring the request to the audience Justifying our requests with appeals to emotion without meaningful data Funders making decisions based on their preconceptions of libraries
What Works
Rebranding the library in context of your political environment Showing how the work of the library supports your funders’ goals Show the return on investment (ROI)
- f the library
Decide on what measurables your stakeholders want as a team
Outcome
- r Performance Based
Budgeting
Translates the work of the library into a form that someone without any knowledge of libraries can understand Sets a framework for how the library and stakeholders will measure success
Teamwork
Consistent Terminology Reach Consensus for What Matters Cherry Pick the Statistics that Support the Consensus
Our Stakeholders
Don’t Know Much of What We Do Don’t Understand our Terminology Find Our Statistics Overwhelming
Durham County Library Measuring for Results
Everything I Thought was Wrong Everything They Thought was Wrong We Came Up with Our Own Right
- A program is a group of expenditures
that achieve a common outcome Programs
- What actions your organization takes to
carry out these programs Activities
- Consist of outputs, efficiencies,
qualitative data and outcome measures. Measures
That was Clear as Mud
Program Definition Worksheet
Date:Program Title (working
title)What's included (list main
activities in this program ) "Why" or purpose of program (key words) "For whom" (only if client or customer is important to differentiate at this point)Questions, Issues
- r Notes
Size (approximate staff
and $ -- rough estimate) STEAM Literacy Library programs for children, teens, and adults. To educate the community in all forms- f literacy for school,
- f the library.
- f these services are
- f Durham and making
Program Definition Worksheet
Date: June 4,2015Program Title (working
title)What's included (list main
activities in this program ) "Why" or purpose of program (key words) "For whom" (only if client or customer is important to differentiate at this point)Questions, Issues
- r Notes
Size (approximate staff
and $ -- rough estimate) Library Services Administration of library (Finance, ELT, Facilities) Public Services (Circulation, Reference, local programing) encourage Discovery, connect the Community and lead in Literacy Includes E-Rate services that provide basic functions of providing service - phone lines, and wireless service- bills. Used # of positions and
- f the library.
- salaries. Other public service
Defining the Activities in Each Program
Durham County Program Name Program Purpose Program Outcome Measure(s) Library Services encourage Discovery, connect the Community and lead in Literacy % of community satisfaction with the library, % of community visiting the library Activity (what we do) Output Efficiency Intermediate Outcomes (Workload or product) (Unit Cost or Productivity) (Service Quality) Administration of Library Cost to use library alternatives Comparison of costs to peers Overall ROI for each county $ spent Cost of lost use % overall customer satisfaction Direct local expenditure Staff compensation Halo spending estimate Staff satisfaction w/work orders # of work orders Average time to complete work- rder
- f community visiting the library
Looking at Our Collection Activities
Durham County Program Name Program Purpose Program Outcome Measure(s) General Collection The library offers resources and materials in multiple formats that support the library's mission. % of patrons satisfied or very satisfied with the collection Activity (what we do) Output Efficiency Intermediate Outcomes (Workload or product) (Unit Cost or Productivity) (Service Quality) Selection and Acquisition # items ordered # items per selector # checkouts per registered users # patron and staff suggestions answered # patron/staff suggestions per selector turnover rate # database sessions average time per item selected relative use rate $ spent (excluding digital) Access # items cataloged by vendor cost per copy-cataloged record complexity and quality of cataloging for vendor and in-house # items cataloged in house cost per original cataloged record # digital items cataloged turn-around time of cataloging volume of records Collection Maintenance & Evaluation # items weeded average # of circs per weeded volume currency of collection: % of items added within last 5 years # items transferred % of patrons satisfied or very satisfied with the currency of collection Digital Collections # items ordered # items per selector % of patrons satisfied or very satisfied with the collection # checkouts average time per item selected # users registered for digital platforms # reserves # checkouts per registered user of digital platforms $ spent Special Collections # of new manuscripts, etc. donated and added Processing time Survey of patron satisfaction with collection # of meetings, programs, publications and presentations # attendees Program evaluations # of questions Time spent per question Customer feedback # of page views for photographic collections and online exhibits Durham County Program Name Program Purpose Program Outcome Measure(s) General Collection The library offers resources and materials in multiple formats that support the library's mission. % of patrons satisfied or very satisfied with the collection Annual collection investment per capita Activity (what we do) Output Efficiency Intermediate Outcomes (Workload or product) (Unit Cost or Productivity) (Service Quality) Selection and Acquisition # items ordered # checkouts per registered users # patron and staff suggestions answered # checkouts per item # database sessions $ spent (excluding digital) Collection Maintenance & Evaluation # items weeded average # of checkouts during the life- f an item
Now You Have to Measure It
Program Data Review Form PROGRAM:Library Services Do You Have the Data? Service Quality Measures Recommended Audience(s) to Report DATE OF THIS VERSION: 6/23/15 Yes, BUT THERE ARE SOME ISSUES Survey/Instrument Status MEASURES No Yes 1 2 3 4 5 6 7 1 2 3 Source or Database Person Responsible Dept. County Mgmt. Public Outcome Measures % of community satisfaction with the library 1 County Survey County 1 % of community visiting the library County Survey County 1 Service Quality Measures Overall ROI for each county $ spent 1 SAP and Horizon Reports Kathy 1 % overall customer satisfaction 1 1 surveys Kathy 1 % of exiting staff who report satisfaction with library employment 1 1 Lakesia? Lakesia? 1 % FTE staff turnover 1 1 Lakesia Lakesia 1 % of circulated items that are self-checked 1 1 Web Reporter IT Admin 1 # of Items circulated per Borrower 1 1 Web Reporter IT Admin 1 % Population who are Active Cardholders 1 1 Web Reporter and Census IT Admin 1 % of customers who are satisfied or very satisfied with questions answered 1 1 surveys Kathy 1 % of attendees who are satisfied or very satisfied with programs 1 1 surveys Kathy 1 Efficiency Measures Library cost per capita 1 1 SAP and Census Kathy 1 Staffing per capita 1 1 Lakesia and census Kathy 1 # Items per circulation staff transaction 1 1 Web Reporter IT Admin 1 # Items per self-check transaction 1 1 Web Reporter IT Admin 1 # of questions answered/reference staff member 1 1 Count at service points IT Admin 1 Output Measures # of FTE's managed 1 1 Lakesia Lakesia 1 # of Physical Items Circulated 1 1 Web Reporter IT Admin 1 # of Active Borrowers 1 1 Web Reporter IT Admin 1 # of Virtual Items Circulated 1 1 Web Reporter IT Admin 1 # of Total Items Circulated 1 1 Web Reporter IT Admin 1 # Reserves 1 1 Web Reporter IT Admin 1 # of total questions answered 1 Count at service points Kathy 1 # of technology questions 1 Count at service points Kathy 1 # of job related questions 1 Count at service points Kathy 1 # of programs at locations 1 Evanced IT Admin 1 # of attendees 1 Evanced IT Admin 1KEYS Use a "1" to mark applicable columns
Do you have the data? (B-C)- 1. Yes, we have the data and there are no changes
- 2. No, we do not have the data. We need to develop a
- 1. Data is available in a database but it is not up to date.
- 2. Data is partially automated and partially manual.
- 3. Data is all manual.
- 4. Data is collected by other agency without our access.
- 5. Data is very limited to no data at all.
- 6. Data e1ists but we cannot e1tract the data.
- 7. There is another problem or change needed. (insert a
- 1. A survey/instrument e1ists and was completed within
- 2. A survey/instrument e1ists and was not completed in
- 3. A survey/instrument does not e1ist.
Where Do These Magical Data Come From?
Traditional In House Statistics Combined with Open Data Random Free Library Tools Consumer Data
ROI Calculator
http://www.lrs.org/public/ro i/calculator.php Mouseover libraries to see closest match or use: http://www.lrs.org/data- tools/public- libraries/annual-statistics/ to choose peer library.
ROI Example
Choosing Peer Libraries
PLS (Public Library Survey) v. PLDS (Public Library Data Service Statistical Report) https://www.imls.gov/research-evaluation/data-collection/public-libraries-united-states-survey https://nc.countingopinions.com/
How We Compare to Our Peers
0.0% 10.0% 20.0% 30.0% 40.0% 50.0% 60.0% 70.0% 80.0%
% of Population with Library Cards
Technology Peers
Library Edge Assessment http://www.libraryedge.org/
National Trend Survey Data
http://libraries.pewinternet.org/
Wages
Metropolitan and Nonmetropolitan Area Occupational Employment and Wage Estimates from the Bureau of Labor Statistics http://www.bls.gov/oes/current/oessrcma.htm
Your Budget Adjusted for Inflation
Bureau of Economic Analysis Table 3.15.4 http://www.bea.gov/itable/
$- $0.50 $1.00 $1.50 $2.00 $2.50 $3.00 $- $5,000,000 $10,000,000 $15,000,000 $20,000,000 $25,000,000 2000 2001 2002 2003 2004 2005 2006 2007 2008 2009 2010 2011 2012
Per capita appropriation Total appropriation
North Carolina state aid to public libraries appropriation
Inflation adjusted appropriation Per capita inflation-adjusted appropriation
Data Visualizations from the Census
Tapestry from ESRI
The Kindness of Strangers
- Look for Open Data projects from your state and local area
- Hackerspaces with Open Data projects
Don’t Let This Happen to You
Citations
Librarian Pulp Fiction Images ACME Upstairs Library School http://simplebooklet.com/publish. php?wpKey=zwTY8mLCC3wV31O RtETcye#page=0 ROI Details
- Library Research Service ROI Calculator,
http://www.lrs.org/public/roi/calculator.php
- “Cost to use alternatives” – Cost to patrons to acquire
information or materials from an alternative source if the library did not exist
- “Lost use” – Direct benefit patrons who chose not to seek
information elsewhere would lose if the library did not exist
- Local expenditures – What the library spends on goods
and services in its community
- Lost staff compensation – Salaries and wages that would
not be paid without the library
- “Halo spending” – Purchases made by patrons at
businesses near the library when they visit