
SLIDE 1
On Fair Selection in the Presence of Implicit Variance Emelianov, - - PowerPoint PPT Presentation
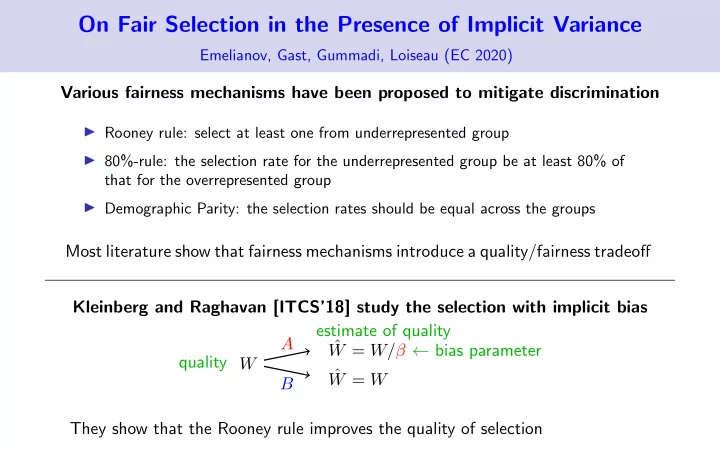
On Fair Selection in the Presence of Implicit Variance Emelianov, Gast, Gummadi, Loiseau (EC 2020) Various fairness mechanisms have been proposed to mitigate discrimination Rooney rule: select at least one from underrepresented group
1 1.2 1.4 1.6 1.8 2 1 2 3
0.2 0.4 0.6 0.8 1 5 10
budget at 1st stage
budget at 2nd stage 0.5 1 2 4
Ud.p. 1 − Ug.obl. 1 Ug.obl. 1
, %
0.5 1 2 4
Ud.p. 2 − Ug.obl. 2 Ug.obl. 2
, %
1 stage
2 stage