
SLIDE 1
October 18, 2001 October 18, 2001 The Daiwa Bank, Ltd. The Daiwa - - PowerPoint PPT Presentation
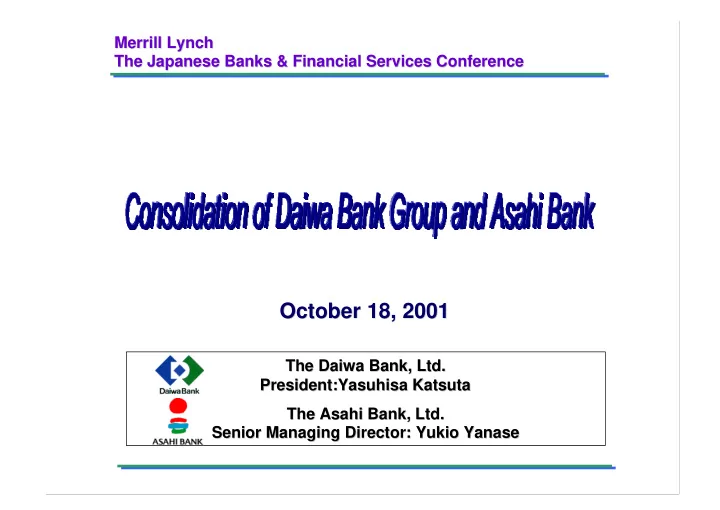
Merrill Lynch Merrill Lynch The Japanese Banks & Financial Services Conference The Japanese Banks & Financial Services Conference October 18, 2001 October 18, 2001 The Daiwa Bank, Ltd. The Daiwa Bank, Ltd. President:Yasuhisa Katsuta
P1 Gist of Management Consolidation P2 Outline of the Holding Company P3 Outline of Management Consolidation and Business Reorganization P4 Spin-off of Trust Business Unit of Daiwa Bank and Subsequent Reorganization as a JV P5 Establishment of Holding Company: Outline of Stock Transfer Scheme P6 Realizing Synergies from Management Consolidation P7 Intensive Allocation of Resources on Retail Banking Businesses P8 Comparison of Corporate Customers and Covering Rates in Major Markets P9 Industry Top Performance in Housing Loan P10 Industry Top Shares in Pension and Will Trusts P11 Particular Strength in Pension Funds Entrusted from SMEs P12 Synergies between Banking and Trust Businesses P13 Rationalization Effects of Management Consolidation P14 Financial Targets of the Group Banks
【
Reference Materials】
R-1 Deposit and Loan Shares in Major Markets
1
Daiwa Bank Holdings, Inc (at the time of establishment) (The name will be changed so as to make it better reflect the group identity)
¥ 380 billion
Takashi Kaiho (chairman of Daiwa Bank)
Yasuhisa Katsuta (president of Daiwa Bank)
Yasuhiro Takatani (president of Kinki Osaka Bank) Masao Nomura (president of Nara Bank) Atsumu Kuroishi (deputy president of Daiwa Bank) Ryo Aoyagi (senior managing director of Daiwa Bank) Sadao Tanaka (managing director of Daiwa Bank) Yoshinari Demura (director of Kinki Osaka Bank) * Yukio Yanase (senior managing director of Asahi Bank) will be appointed as deputy president when Asahi Bank joins the holding company.
Formulation of group management and business strategies, decision on allocation of management resources of the group, supervision of subsidiaries’
Other board members, organizational structure, amount of capital at the time Asahi Bank joins Daiwa Bank Holdings, etc. will be discussed and determined hereafter. 2
December 12, 2001 Osaka City (Current Daiwa Bank’s head office location)
The businesses of the four banking business subsidiaries will be reorganized based on the basic concept of becoming a consortium of regional financial institutions.
At earliest time ・Asahi bank joins the holding company (becoming a subsidiary of the holding company possible after the through transfer of shares) establishment of a holding company JV Basically within Partner(s) current fiscal year Trust Daiwa
Kinki Osaka
Nara Asahi Bank Bank
Bank
Bank Bank Holding Company
3
Establishment of ・Daiwa Bank, Kinki Osaka Bank and Nara Bank jointly establishes a holding company Holding Company ・Spin-off trust business unit of Daiwa Bank and reorganize it as a subsidiary trust bank (Dec 12, 2001) ・Make the trust bank subsidiary a joint venture with other institutions Spin-off of trust JV business unit Partner(s) (Within current fiscal year) Trust Daiwa
Kinki Osaka
Nara Bank Bank
Bank
Bank Holding Company
4
Asahi Bank will join the Daiwa Bank Holdings after it is established by Daiwa Bank Group. In principle, Asahi Bank is scheduled to join during the current fiscal year. ・ Investments in subsidiaries ・ Capital( New share issuance) Shares of = (A) + (B) + (C) + (D) ・ Capital Surplus Issuance of four banks
Investments ≒ Stockholders' Equity
new shares
Daiwa Bank Holdings, Inc.
Stockholders' Equity (D)
Asahi Bank
Stockholders' Equity (A) Stockholders' Equity (B) Stockholders' Equity (C)
Daiwa Bank Kinki Osaka Bank Nara Bank
Former Shareholders of Daiwa Bank
Shareholders of the Holding Company
Former Shareholders of Kinki Osaka Bank Former Shareholders of Nara Bank Former Shareholders of Asahi Bank 5
[Share transfer ratio] (Date of share transfer: Dec 11, 2001) Daiwa Bank 1 Kinki Osaka Bank 0.75 Nara Bank 14 * Share transfer ratio of Asahi Bank will be determined, hereafter
Daiwa Kinki Osaka Nara Asahi Total Tokyo Mtp. Area 44 1 251 296 Chubu Region 2 2 11 15 Kansai Region 97 214 25 34 370 Other Regions 17 21 38 Total 160 217 25 317 719 Domestic Head & Branch Offices (End of March, 2001) 6
56.4 61.0 54 56 58 60 62 End of Mar. 2001
【
Ratio of Individual Deposits (%)】
Daiwa + Asahi
* Ratio of Individual Deposits = Individual Deposit Balance / Total Domestic Deposit Balance
17.3 26.0 5 10 15 20 25 30 End of Mar. 2001
【
Ratio of Housing Loans to Total Lending (%)】
Daiwa + Asahi
* Ratio of Housing Loans = Housing Loan Balance / Total Loan Balance 7 69.7 75.8 65 67 69 71 73 75 77 End of Mar. 2001
【
Ratio of Loans to SMEs and Individuals (%)】
Daiwa + Asahi
・ Figures are extracted from “Cosmos 2” corporation data-base. ・ Each group is comprised of the following banks: 【 Daiwa Gr.+Asahi】 …Daiwa+Kinki Osaka+Nara+Asahi Other mega-bank groups also include first and second-tier regional banks. ・ Group figures are shown after the adjustments to exclude intra-group
8
【
Osaka Pref.】 37,080 39,195 36,560 16,202 10,079 11.3% 18.2% 41.0% 44.0% 41.6% 10,000 20,000 30,000 40,000 Daiwa Gr. +Asahi Maga Gr. A Maga Gr. B Mega Gr. C Mega Gr. D 0.0% 10.0% 20.0% 30.0% 40.0% 50.0%
Covering Rate
Total No. of Corporations: 89,066
【
Saitama Pref.】 18,568 4,864 3,017 6,595 3,018 42.1% 6.8% 15.0% 6.8% 11.0% 5,000 10,000 15,000 20,000 Daiwa Gr. +Asahi Maga Gr. A Maga Gr. B Mega Gr. C Mega Gr. D 0.0% 5.0% 10.0% 15.0% 20.0% 25.0% 30.0% 35.0% 40.0% 45.0%
Covering Rate
Total No. of Corporations: 44,069
【
Tokyo Pref.】 37,220 68,457 42,422 81,063 55,109 36.1% 22.4% 42.8% 29.1% 19.6% 10,000 20,000 30,000 40,000 50,000 60,000 70,000 80,000 90,000 Daiwa Gr. +Asahi Maga Gr. A Maga Gr. B Mega Gr. C Mega Gr. D 0.0% 5.0% 10.0% 15.0% 20.0% 25.0% 30.0% 35.0% 40.0% 45.0%
Covering Rate
Total No. of Corporations: 189, 566
Comparison of Cumulative Increase in Past Five Years & Change in Shares among City Banks Comparison of Cumulative Increase in Past Five Years & Change in Shares among City Banks Comparison of Housing Loan Balance & Shares among City Banks Comparison of Housing Loan Balance & Shares among City Banks
9 8.0 11.8 7.7 10.9 5.9
24.7% 26.6% 18.0% 17.5% 13.2% 0.0 2.0 4.0 6.0 8.0 10.0 12.0 14.0 Daiwa + Asahi Sumitomo + Sakura Sanwa + Tokai DKB + Fuji BOTM 0.0% 5.0% 10.0% 15.0% 20.0% 25.0% 30.0%
Balance Share City Banks Total: ¥44.3 Tril. (End of Mar. 2001) ( ¥ Tri.)
+0.2% +3.0% 0.0 0.5 1.0 1.5 2.0 2.5 3.0 Daiwa + Asahi Sumitomo + Sakura Sanwa + Tokai DKB + Fuji BOTM
0.0% 0.5% 1.0% 1.5% 2.0% 2.5% 3.0% 3.5%
Amount of cumulative increase Change in share
Up Down
Cumulative Increase of City Banks Total: ¥7.9 Tril. (FY1996~FY 2000) ( ¥ Tri.)
Total: ¥37.4 trillion (End of March, 2001) Total: 31,251 contracts (End of March, 2001) Pension Fund Assets Will Trusts
Trust Bank F 3% Foreign Trust Banks 8% Trust Bank E 12% Trust Bank D 13% Trust Bank C 14% Trust Bank B 16% Trust Bank A 17%
Trust Bank B 20 % Trust Bank G 16 % Trust Bank E 14 % Trust Bank F 13 % Trust Bank A 7% Trust Bank C 7 %
10
Number of Lead Manager Funds
(Tax-Qualified Pension Funds + Welfare Pension Funds)
Number of Lead Manager Funds (Jointly Established Welfare Pension Funds)
Trust Bank F 4% Trust Bank C 11% Trust Bank E 13% Trust Bank D 13% Trust Bank A 13% Trust Bank B 19%
Trust Bank B 19% Trust Bank E 16 % Trust Bank A 15% Trust Bank D 11% Trust Bank F 1% Trust Bank C 7 %
Total: 10,591 funds (End of March, 2001) Total: 454 funds (End of March, 2001)
11
Deposits Loans Other Banking Services Deposits Loans Other Banking Services
Pension Plan Designing, 401(k), etc. Inheritance, Business Succession Utilization of Real Estates, etc. Pension Plan Designing, 401(k), etc. Inheritance, Business Succession Utilization of Real Estates, etc.
Pension and Corporate Trusts Will Trust Rearrangement of inherited property Total wealth management account Pension and Corporate Trusts Will Trust Rearrangement of inherited property Total wealth management account
Asset Management & Administration
12
<Summary of Consolidation Effects>
and reduction of personnel
products and services
and systems, etc
Consolidation Effects from Participation of Asahi Bank at the end of March, 2001) Number of Head and
(238)
Branch Offices
(32%)
Daiwa Bank (14) Kinki Osaka Bank (27) Nara Bank Asahi Bank (47) -
(6,307) (27%)
Daiwa Bank (982) Kinki Osaka Bank (694) Nara Bank 10 Asahi Bank (1,241) - G&A Expenses
(67.8)
(Billions of yen)
(14%)
Daiwa Bank (2.9) Kinki Osaka Bank 0.5 Nara Bank 0.2 Asahi Bank (7.6) - (100) (1,700) (28.0) (50) (1,700) (30.0)
(9.8) (28.0) (30.0) (100) (50) (1,700) (1,700)
Number of Employees
(88) (2,907)
(Announced on Sep. 21) (FY 2001 to FY 2004) (Announced on Aug.1) (Comparison with figures Revitalization Plans
Consolidation Effects of Daiwa Bank Group Total Consolidation Effects
13
Group banks will strive to achieve the following financial targets within five years after management consolidation
Net Business Profits (Bil. Yen)
288.5
Daiwa Bank 109.5 Increase of Kinki Osaka Bank 11.7 181.5 billion yen Nara Bank 0.6 Rate of increase: Asahi Bank 166.7 approximately 63% Consolidated Capital Adequacy Ratio - Daiwa Bank 11.33% Kinki Osaka Bank
(Note 1)
6.23% Nara Bank 8.43% Asahi Bank 11.14% ROE (Net Business Profits/Term-end Balance
Daiwa Bank 11.8% Kinki Osaka Bank 13.7% Nara Bank 6.7% Asahi Bank 12.3% OHR (G&A Expenses/Gross Operating Profits)
61.8%
Daiwa Bank 58.5% Kinki Osaka Bank
(Note 2)
80.5% Nara Bank 76.2% Asahi Bank 60.3% Note 1. Following the capital increase in April 2001 with public funds, capital adequacy ratio rose to 8.59%. Note 2. G&A expenses for fiscal 2000 includes temporary cost related to the acquisition of operations from the former Namihaya Bank. OHR for the previous fiscal year was 72.9%. Results for FY 2000 Targets after Consolidation Comparison with Actual Results for FY2000 ― To be raised to the level of 470 billion yen Approximately 10% 16% or more Less than 50%
12.1%
Increase of 4.1% or more Decrease of 11.8% or more 14
・ Market shares are computed based on monthly BOJ statistics and others. ・ Group shares are based on the sum of the figures of the group banks as of the end of March 2001. ・ Daiwa Bank’s trust account is not reflected on the market shares shown in the above charts.
【
Group Deposit Shares in Major Markets】 22.6% 43.2% 7.0%
0% 20% 40% 60% 80% 100%
Osaka Pref. Tokyo Pref. Saitama Pref. Daiwa Gr.+Asahi Others
【
Group Loan Shares in Major Markets】 19.1% 43.3% 6.7%
0% 20% 40% 60% 80% 100%
Osaka Pref. Tokyo Pref. Saitama Pref. Daiwa Gr.+Asahi Others R-1
This presentation material and the oral presentation based on this material contain statements that constitute forward looking statements. These statements may be orally expressed from time to time during the presentation session and also appear in a number of places in this presentation material. They include statements regarding the intent, belief, or current expectations of Daiwa Bank (“the Bank,” hereinafter) or its
Such forward looking statements are not guarantees of future performance and involve risks and uncertainties, and actual results may differ from those in the forward looking statements as a result of various factors. Such forward looking statements are based on numerous assumptions regarding the Bank’s present and future business strategies and the environment in which the Bank will operate in the future. The information contained in this presentation material identifies important factors that could cause such differences, including, but not limited to, a change in overall economic conditions, the value of real estate in Japan, and the effect of new legislation or government directives. The Bank expressly disclaim any obligation or undertaking to release publicly any updates or revisions to any forward-looking statement contained herein to reflect any change in the Bank’s expectations with regard thereto or any change in events, conditions or circumstances on which any such statement is based.