Numerical method: systems 1 Equipment performance: dynamic and - - PowerPoint PPT Presentation

numerical method systems
SMART_READER_LITE
LIVE PREVIEW

Numerical method: systems 1 Equipment performance: dynamic and - - PowerPoint PPT Presentation

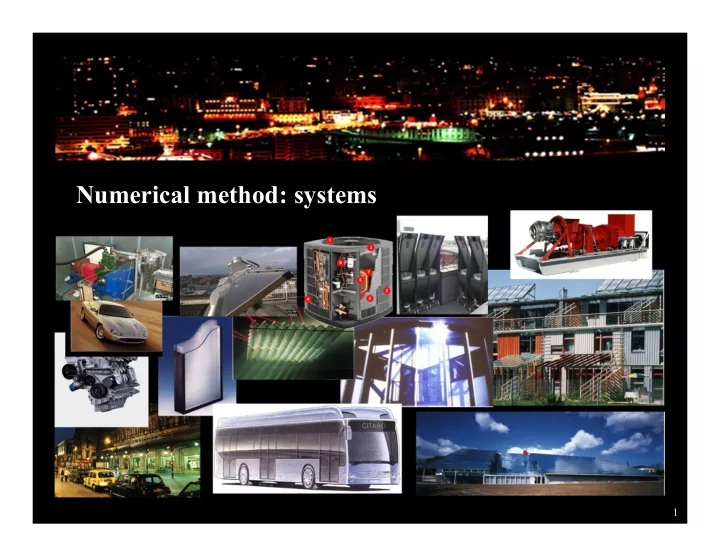
Numerical method: systems 1 Equipment performance: dynamic and non-linear Condenser temp.: 20 C, 30 C, 40 C, 50 C heat pump boiler gas turbine fuel cell wind turbine photovoltaics Issues: dynamic response, conditions monitoring, hybrid


slide-1
SLIDE 1

Numerical method: systems

1

slide-2
SLIDE 2

Equipment performance: dynamic and non-linear

gas turbine fuel cell photovoltaics wind turbine

Issues: dynamic response, conditions monitoring, hybrid systems design and control.

heat pump

Condenser temp.: 20 C, 30 C, 40 C, 50 C

boiler

2

slide-3
SLIDE 3

Plant and systems simulation

Two approaches:  Sequential, where components are replaced by an equivalent input/output relationship so that the output from one component becomes the input to the next. Iteration is then employed to achieve solution convergence throughout the network.  Simultaneous, where plant components are represented by finite volumes and corresponding conservation equations added to the whole system matrix equation.

3

slide-4
SLIDE 4

Sequential vs. simultaneous: pros and cons

 Sequential approach using black-box, input-output models:  supports system design (sizing components);  allows checking that components will work together;  supports testing of system control strategies;  problems with inter-component dependencies;  fixed parameters not valid in off-design conditions.  Simultaneous approach using full numerical discretisation  components have a description of the fundamental processes in each component;  can be used to optimise the internal design of each component;  does not rely on ‘design-condition’ parameters;  can be used to study control variables within components and globally;  requires detailed information (e.g. geometry, material properties) that is not always available from manufacturers.

4

slide-5
SLIDE 5

Example system: ground and air source heat pump

A, B, C: Evaporation and sensible heating of refrigerant in the evaporator (heat transfer from the colder source):

  • convection from source fluid to heat

exchanger surface;

  • conduction through heat exchanger wall;
  • convection to boiling refrigerant.

D: Electrical energy converted into potential energy (pressure) and heat (temperature increase) in compressor. E, F, G: Condensation and sensible cooling of refrigerant in the condenser (heat transfer to hotter sink):

  • convection from condensing refrigerant;
  • conduction through heat exchanger wall;
  • convection from heat exchanger surface to

supply air. H: Pressure drop and cooling across expansion valve.

) ( 1 3 typically for paid useful COP

Heating

 

5

slide-6
SLIDE 6
  • r a simple model, e.g. a

wind turbine:

Heat pump: sequential approach

Parameters

Manufacturer data (performance map) Fluid properties (constant) Entering water temperature & flow Entering air temperature, humidity & flow On/off signal

Inputs Outputs

Leaving water temperature Leaving air temperature & humidity Electrical power Heat flows Component model Inputs Outputs Parameters

6

𝑄 = 1 2 𝜍𝐵𝐷𝑤

slide-7
SLIDE 7

Heat pump: simultaneous approach

7

slide-8
SLIDE 8

Variable discretisation levels

Return air Refrigerant

8

slide-9
SLIDE 9

Discretising plant

9

slide-10
SLIDE 10

Gas central heating system

10

slide-11
SLIDE 11

Solar energy collector with energy storage

11

slide-12
SLIDE 12

Building-integrated photovoltaic system

12

slide-13
SLIDE 13

Fuel cell system

13

slide-14
SLIDE 14

TRNSYS – low energy house with heat pump

http://www.trnsys.com/

14

slide-15
SLIDE 15

[Contained in NLiv] SDHWPump ASHPFlow LivUnFRad ASHP SDHW StratTank DHWDraw ASHPPump NLivUnFRad ASHPReturn NLivFlow STankR2 STankR1 STankFlow SDHWFlow SDHWReturn ValSDHWR ValSDHWF ValHP_DHW_F ValHP_DHW_R Val_Liv Val_NLiv

6 1 2 3 4 28 7 5 9 10 11 12 13 14 15 16 17 18 19 20 21 22 23 24 25 26

1 2 3 4 5 6 7 8 9 10 11 12 13 14 15 16 17 18 19 20 21 22

IPCN N

IPCMP

Monitoring point Temp and ṁ BoostHeat

27

23 24

BHPump

8 29

25

LivT_op

26

NLivT_op

27

Dummy [Contained tn Nliv] [Contained in ambient] [Contained in NLiv] [Contained in NLiv] [Contained in Liv]

IPNO D

2 1 3 2 1 2 1 2 1 merge01

30

28

T_IU T_SPS Flat plate solar collector

ESP-r: linked building, plant and air/water flow network

15

slide-16
SLIDE 16

Hydrogen fuel cells

16

slide-17
SLIDE 17

Renewable energy

Retscreen (https://www.nrcan.gc.ca/energy/software- tools/7465) Homer (http://homer.ucsd.edu/homer/)

17

slide-18
SLIDE 18

Distributed/embedded generation

+

  • inverter

energy storage inverter PV gas turbine converter CHP converter wind turbine Conventional supply connection converter Demand reshaping measures

Built Environment

Power station ………… 1 @ 2000 MW Wind ……. ………… 100 @ 20 MW Marine …………… 4,000 @ 0.5 MW CHP …………… 40,000 @ 0.05 MW Urban RE ……… 200,000 @ 0.01 MW RE systems 3-5 times greater if the requirement is to match energy production. Requires a combined buildings/systems model.

photovoltaic cells Combined heat & power heat pump gas turbine ducted wind turbines 18

slide-19
SLIDE 19

Embedded generation, Lighthouse Building in Glasgow

Demand reduction through transparent insulation, advanced glazing and smart control. PV: 0.7 kWe DWT: 0.6 kWe PV hybrid: 0.8 kWe / 1.5 kWh

total demand: 68 kWh/m2.yr total RE supply: 98 kWh/m2.yr Issues:  accommodating the grade, variability and unpredictability of energy sources/demands;  hybrid systems sizing and maintenance;  strategies for co-operative control of stochastic demand and supply;  active network management for network balancing, fault handling and power quality maintenance.

19

slide-20
SLIDE 20

… the oscillating aerofoil driving hydraulic accumulators

Engineering Business’ Stingray device

… and contra-rotating devices … horizontal axis turbines evolved from wind power technology

Marine Current Turbines’ 300kW prototype (11m dia.) Challenges:  aquaculture impact  reduced reactive torque  simplify moorings  limit corrosion and abrasion  maintenance and safety issues  power take-off at low rotation speed  gearing reduction/elimination  power transmission/grid access  land access and use  phased operation of different sites

Tidal stream energy

minimises the reaction torque

  • n the structure

Nautricity’s 500 kW prototype

20

slide-21
SLIDE 21

Approch is universally applicable

21