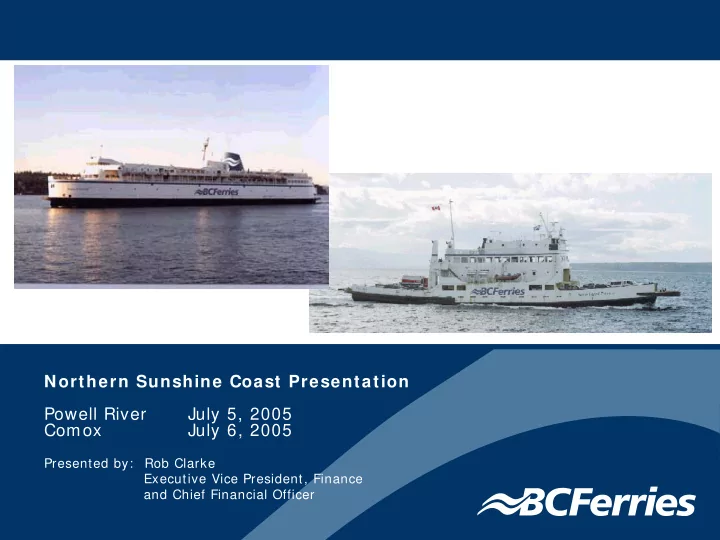

Northern Sunshine Coast Presentation Powell River July 5, 2005 Comox July 6, 2005 Presented by: Rob Clarke Executive Vice President, Finance and Chief Financial Officer
Presentation Overview Route 1 7 and 1 8 � Direct revenues and operating expenses � Indirect revenues and expenses � Allocations � Financial Data for: − Route 17 Comox – Powell River − Route 18 Powell River – Texada Island 3
Direct Revenues & Expenses � Direct revenues are revenues that can be directly attributable to a route. These include tariffs, catering revenues and parking fees. � Direct operating expenses are costs incurred in the operation and maintenance of vessels and terminals. 4
I ndirect Revenues & Expenses � Indirect revenues are revenues that are not directly attributable to a route. These include foreign exchange and marketing rights. � Indirect expenses are costs incurred at the corporate level to support operations. These costs include amortization, financing expense, corporate services, income/ loss from subsidiary companies and gain/ loss on the sale of fixed assets. 5
Allocations � When there is no direct link to a route, the revenues and expenses are allocated to routes based on the driver of the item. � Examples include: − Vessel sailing hours (used to allocate marine insurance and vessel refit and maintenance) − Vehicle through put (used to allocate terminal costs) − Net book value of capitalized assets (used to allocate financing expense) 6
Pow ell River/ Com ox Sum m ary $ Thousands 2 0 0 4 2 0 0 4 2 0 0 5 Forecast Actual Prelim inary Revenue from Customers 6,327 6,368 6,998 Government Fees for 8,468 8,516 8,606 Service Total Revenue 14,795 14,884 15,604 Operating Expenses 12,606 13,064 16,646 Amortization 971 1,215 1,308 Financing Expense 1,187 541 553 Loss on disposal of fixed 0 28 10 assets Net I ncom e ( Loss) 3 1 3 6 ( 2 ,9 1 3 ) 7
Pow ell River/ Texada Sum m ary 2 0 0 4 2 0 0 4 2 0 0 5 Forecast Actual Prelim inary Revenue from Customers 944 804 859 Government Fees for 4,216 4,221 4,234 Service Total Revenue 5,160 5,025 5,093 Operating Expenses 3,816 5,191 4,831 Amortization 145 348 403 Financing Expense 302 173 267 Loss on disposal of fixed 0 41 1 assets Net I ncom e ( Loss) 8 9 7 ( 7 2 8 ) ( 4 0 9 ) 8
Route 1 7 Revenue from Custom ers 2 0 0 4 2 0 0 5 Forecast Prelim inary Tariff Revenue 5,598 5,741 6,320 Net Catering 479 506 563 Parking & Other 250 121 115 Total 6 ,3 2 7 6 ,3 6 8 6 ,9 9 8 9
Route 1 8 Revenue from Custom ers $ Thousands 2 0 0 4 2 0 0 4 2 0 0 5 Forecast Actual Prelim inary Tariff Revenue 899 782 832 Net Catering 5 3 3 Other 40 19 24 Total 9 4 4 8 0 4 8 5 9 Vehicle Traffic 105,918 92,812 95,024 Passenger Traffic 215,059 193,330 191,368 10
Governm ent Fees for Service 2 0 0 4 2 0 0 5 Forecast Prelim inary Route 1 7 Ferry Service Fees 6,289 6,289 6,290 Social Programs 518 560 623 Federal Contract 1,661 1,667 1,693 Total 8 ,4 6 8 8 ,5 1 6 8 ,6 0 6 11
2 0 0 4 Revenue & Stats Route 1 7 Tariff Revenue 5,741 782 323,023 Net Catering 506 3 39,908 Parking & Other 121 19 16,280 Total 6 ,3 6 8 8 0 4 3 7 9 ,2 1 1 % of Total 1 .7 % 0 .2 % 1 0 0 .0 % 12
Recommend
More recommend