
SLIDE 1
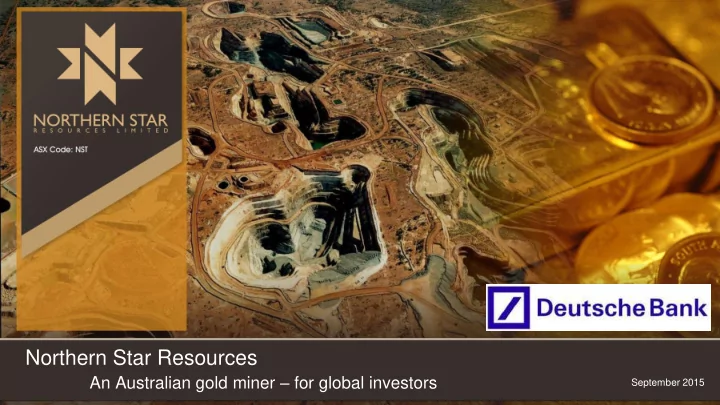
Northern Star Resources
An Australian gold miner – for global investors
September 2015
Northern Star Resources An Australian gold miner for global - - PowerPoint PPT Presentation
Northern Star Resources An Australian gold miner for global investors September 2015 Disclaimer Competent Persons Statements The information in this announcement that relates to exploration results, data quality, geological interpretations
September 2015
2
Competent Persons Statements The information in this announcement that relates to exploration results, data quality, geological interpretations and Mineral Resource estimations for the Company’s Kanowna, EKJV, Kundana and Carbine Project areas is based on information compiled by Darren Cooke and fairly represents this information. Mr Cooke is a Member of the Australian Institute of Geoscientists who is a full-time employee of Northern Star Resources Limited who has sufficient experience which is relevant to the style of mineralisation and type of deposit under consideration and to the activity which he is undertaking to qualify as a Competent Person as defined in the 2012 Edition of the "Australasian Code for Reporting of Exploration Results, Mineral Resources and Ore Reserves“. Mr Cooke consents to the inclusion in this announcement of the matters based on this information in the form and context in which it appears. The information in this announcement that relates to exploration results, data quality, geological interpretations and Mineral Resource estimations for the Company’s Jundee, Plutonic and Paulsens Project areas is based on information compiled by Brook Ekers and fairly represents this information. Mr Ekers is a Member of the Australian Institute of Geoscientists who is a full-time employee of Northern Star Resources Limited and has sufficient experience which is relevant to the style of mineralisation and type of deposit under consideration and to the activity which he is undertaking to qualify as a Competent Person as defined in the 2012 Edition of the "Australasian Code for Reporting of Exploration Results, Mineral Resources and Ore Reserves". Mr Ekers consents to the inclusion in this announcement of the matters based on this information in the form and context in which it appears. The information in this announcement that relates to Ore Reserve estimations for the Company’s Project areas is based on information compiled by Jeff Brown and fairly represents this information. Mr Brown is a Member of the Australian Institute of Mining and Metallurgy who is a full-time employee of Northern Star Resources Limited and has sufficient experience which is relevant to the style of mineralisation and type of deposit under consideration and to the activity which he is undertaking to qualify as a Competent Person as defined in the 2012 Edition of the "Australasian Code for Reporting of Exploration Results, Mineral Resources and Ore Reserves". Mr Brown consents to the inclusion in this announcement of the matters based on this information in the form and context in which it appears. The information in this announcement that relates to Mineral Resource estimations for the Central Tanami Project is extracted from the Tanami Gold NL ASX announcement entitled “Quarterly Report for the Period Ending 31 March 2014” released
estimates of Mineral Resources or Ore Reserves, that all material assumptions and technical parameters underpinning the estimates in the relevant market announcement continue to apply and have not materially changed. The Company confirms that the form and context in which the Competent Person’s findings are presented have not been materially modified from the original market announcement. The information in this announcement that relates to Mineral Resource estimations for the Groundrush Project is extracted from the Tanami Gold NL ASX announcement entitled “Groundrush Deposit Update - Significant Growth In Measured and Indicated Mineral Resource and Increase In Resource Grade At Groundrush” created on 7 January 2013 and is available to view on www.tanami.com.au. The Company confirms that it is not aware of any new information or data that materially affects the information included in the original market announcement and, in the case of estimates of Mineral Resources or Ore Reserves, that all material assumptions and technical parameters underpinning the estimates in the relevant market announcement continue to apply and have not materially changed. The Company confirms that the form and context in which the Competent Person’s findings are presented have not been materially modified from the original market announcement. Forward Looking Statements Northern Star Resources Limited has prepared this announcement based on information available to it. No representation or warranty, express or implied, is made as to the fairness, accuracy, completeness or correctness of the information, opinions and conclusions contained in this announcement. To the maximum extent permitted by law, none of Northern Star Resources Limited, its directors, employees or agents, advisers, nor any other person accepts any liability, including, without limitation, any liability arising from fault or negligence on the part of any of them or any other person, for any loss arising from the use of this announcement or its contents or otherwise arising in connection with it. This announcement is not an offer, invitation, solicitation or other recommendation with respect to the subscription for, purchase or sale of any security, and neither this announcement nor anything in it shall form the basis of any contract or commitment whatsoever. This announcement may contain forward looking statements that are subject to risk factors associated with gold exploration, mining and production businesses. It is believed that the expectations reflected in these statements are reasonable but they may be affected by a variety of variables and changes in underlying assumptions which could cause actual results or trends to differ materially, including but not limited to price fluctuations, actual demand, currency fluctuations, drilling and production results, reserve estimations, loss
estimates. All currency conversions in this presentation have been converted at a currency of AUD/USD conversion rate of A$0.70c
1 Group Resources include 0.67Moz contribution from the 25% Central Tanami Joint Venture
Source: Bloomberg
3
3
5
0.94Moz 1.4Moz 2.2Moz 6.2Moz 8.9Moz
2,000 3,000 4,000 5,000 6,000 7,000 8,000 9,000 10,000 Jun-10 Jun-11 Jun-12 Jun-13 Jun-14 Jun-15 '000 ounces
Measured Indicated Inferred Reserves
6
* Refer ASX Announcement released 4 August 2015
7
Page 8
8
Page 9
9
10
Page 11
11
KANOWNA CAMP KUNDANA CAMP CARBINE CAMP
10km 20km 30km 40km 50km 60km
the Paradigm Orebody PARADIGM NORTH (NST 100%) 18m @ 17.9 gpt 3m @ 50.4gpt 16m @ 6.0 gpt
mapping and sampling GOLDEN EYE (NST 100%) 1m @ 22.0gpt 5m @ 8.2gpt 3m @ 5.3gpt
mapping, targeting K2 AMBITION (EKJV, 51%) 2m @ 11.3gpt 2m @ 9.8gpt 3m @ 5.0gpt
the Centenary Orebody DRAKE HIGH GRADE (EKJV, 51%) 3m @ 18.2gpt 1m @ 25gpt 5m @ 5.3 gpt
veins in Porphyry SIX MILE (NST 100%) 3m @ 29.2gpt 4m @ 12.2gpt 11m @ 6.0gpt
WHITE FEATHER (NST 100%) 1m @ 5,328gpt 0.3m @ 303.1gpt 1m @ 60.3gpt
CHRISTMAS (NST 100%) 0.9m @ 31.7gpt 1.6m @ 24.4gpt 1.3m @ 4.3gpt
12
Page 13
13
Page 14
14
15
*See ASX announcement dated 3 August 2015
16
17
* Source Bloomberg
September 2015
* As at 15 September 2015
Page 19
Institutions 66% Board & Management 5% High Net Worth Individuals 10% Retail 19%
19