
SLIDE 1
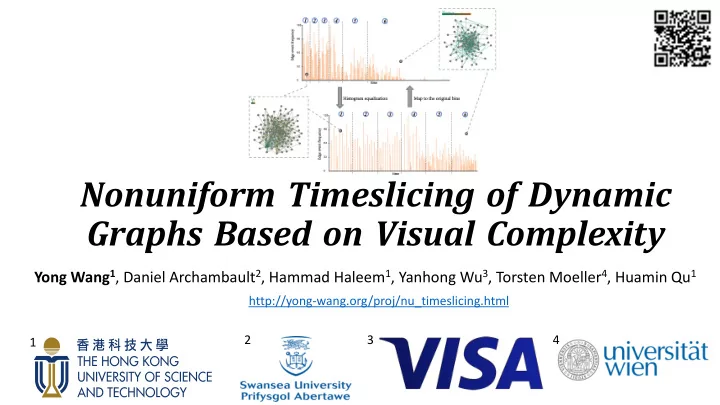
Nonuniform Timeslicing of Dynamic Graphs Based on Visual Complexity
Yong Wang1, Daniel Archambault2, Hammad Haleem1, Yanhong Wu3, Torsten Moeller4, Huamin Qu1
1 2 3 4 http://yong-wang.org/proj/nu_timeslicing.html
Nonuniform Timeslicing of Dynamic Graphs Based on Visual Complexity - - PowerPoint PPT Presentation
Nonuniform Timeslicing of Dynamic Graphs Based on Visual Complexity Yong Wang 1 , Daniel Archambault 2 , Hammad Haleem 1 , Yanhong Wu 3 , Torsten Moeller 4 , Huamin Qu 1 http://yong-wang.org/proj/nu_timeslicing.html 2 3 4 1 Background A
Yong Wang1, Daniel Archambault2, Hammad Haleem1, Yanhong Wu3, Torsten Moeller4, Huamin Qu1
1 2 3 4 http://yong-wang.org/proj/nu_timeslicing.html
2
3
4
5
6
https://www.tutorialspoint.com/dip/histogram_equalization.htm
Image Contrast Enhancement Dynamic Graph Visualization Low color contrast Visual clutter in some timeslices Color convergence in certain color range Edge bursting in certain time range Re-distribute color bins for equal distribution Problems Causes Solutions
7
How ???
8
For the i-th bin in the original time series, histogram equalization will transform it to the following bin: Where , T is the total time range, 𝐹" is the number of edge events in the i-th bin and 𝐹 is the total number of edge events.
9
1 2 3 4 5 6 1 2 3 4 5 6 time time Edge event frequency Edge event frequency
Histogram equalization Map to the original bins
10
11
12
1
11 10
9
2 3 4 5 6 7 8
https://arxiv.org/abs/1709.00372
12
1 2 3 4 5 6 7 8 9
10
11 12
13
Yong Wang1, Daniel Archambault2, Hammad Haleem1, Yanhong Wu3, Torsten Moeller4, Huamin Qu1
1 2 3 4 http://yong-wang.org/proj/nu_timeslicing.html