Needs Assessment Tool (NAT) I have been struck by how important - - PowerPoint PPT Presentation

needs assessment tool nat
SMART_READER_LITE
LIVE PREVIEW

Needs Assessment Tool (NAT) I have been struck by how important - - PowerPoint PPT Presentation

Needs Assessment Tool (NAT) I have been struck by how important measurement is to improving the human condition. You can achieve incredible progress if you set a clear goal and find a measure that will drive progress toward that goal


slide-1
SLIDE 1

Needs Assessment Tool (NAT)

1

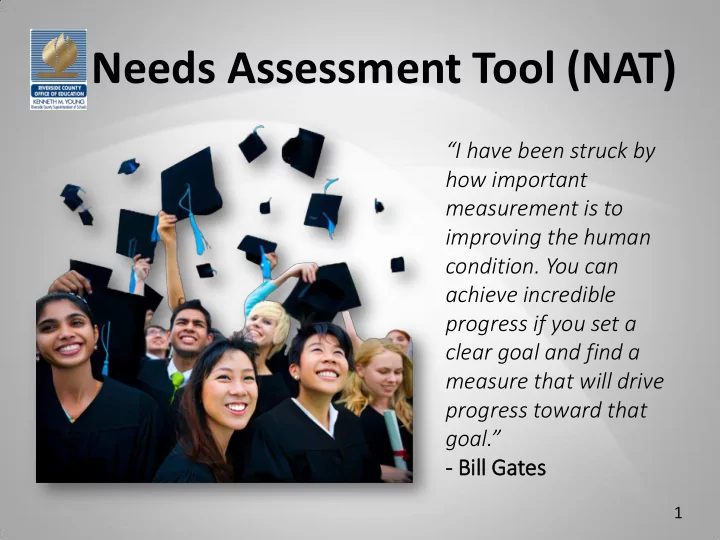
“I have been struck by how important measurement is to improving the human

  • condition. You can

achieve incredible progress if you set a clear goal and find a measure that will drive progress toward that goal.”

  • Bill

ill Ga Gates

slide-2
SLIDE 2

Purpose and Design

2

  • Simplify needs analysis.
  • Identify district and subgroup performance

across all LCAP metrics at-a-glance.

  • Display historical trends by subgroup.
  • Highlight underperforming subgroups.
  • Set goals.
  • Prioritize and target actions and services.
  • Monitor yearly progress.
slide-3
SLIDE 3

NAT Dashboard

3

  • All LCAP metrics are displayed in a single concise format.
  • Each cell displays three years of trend data for comprehensive analysis.
  • Cell format and stoplight indicators highlight performance.
slide-4
SLIDE 4

Interpreting Cell Data

  • The numeric value in the cell is

a percent value (i.e., 50.0 = 50.0%).

  • The numeric value displayed in

the cell corresponds to the year displayed in the Year column.

  • The trend line displays three

years of data.

  • The third trend line marker

corresponds to the value displayed in the cell.

  • The first two trend line markers

display the previous two years

  • f data.
  • The cell height is the y-axis for

the trend line.

– The top of the cell represents 100%. – The bottom of the cell represents 0%.

4

slide-5
SLIDE 5

Analysis, Planning & Goal Setting

  • The pink cell shading indicates

that the subgroup’s value is below the district value for that specific metric.

  • The stoplights indicate overall

subgroup performance for a given state priority relative to the district mean.

– Green: All metrics with data are above the district mean. – Yellow: Greater than 50% or more metrics are above the district mean. – Red: 50% or less metrics are above the district mean.

5

slide-6
SLIDE 6

Progress Monitoring

  • Measure the impact of

your actions and services with the growth report.

  • Monitor the difference

between the current year and the previous for each metric and subgroup.

6

slide-7
SLIDE 7

NAT Data Population

7

We can populate the NAT with your data For additional information, please contact: Steve Ayón, Data Coordinator Assessment and Accountability Services (951) 826-6601

slide-8
SLIDE 8

Commonly Asked Questions

8

Is the Needs Assessment Tool free? The blank NAT is free and ready to populate. Where can I get the NAT? The NAT can be found at: http://www.rcoe.us/educational- services/assessment-and-accountability- services/lcap-development-resources/

slide-9
SLIDE 9

Needs Assessment Tool

9