
14‐May‐14
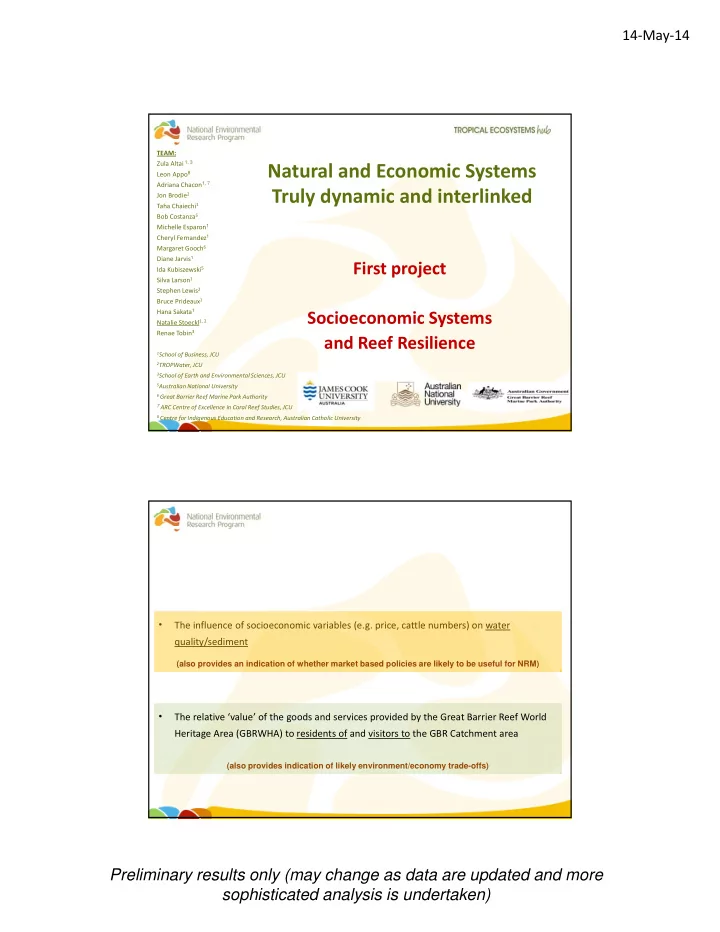
Preliminary results only (may change as data are updated and more sophisticated analysis is undertaken)
TEAM: Zula Altai 1, 3 Leon Appo8 Adriana Chacon1, 7 Jon Brodie2 Taha Chaiechi1 Bob Costanza5 Michelle Esparon1 Cheryl Fernandez1 Margaret Gooch6 Diane Jarvis1 Ida Kubiszewski5 Silva Larson1 Stephen Lewis2 Bruce Prideaux1 Hana Sakata1 Natalie Stoeckl1, 2 Renae Tobin3
1School of Business, JCU 2TROPWater, JCU 3School of Earth and Environmental Sciences, JCU 5Australian National University 6 Great Barrier Reef Marine Park Authority 7 ARC Centre of Excellence in Coral Reef Studies, JCU 8 Centre for Indigenous Education and Research, Australian Catholic University
First project Socioeconomic Systems and Reef Resilience
Natural and Economic Systems Truly dynamic and interlinked
(also provides indication of likely environment/economy trade-offs)
- The influence of socioeconomic variables (e.g. price, cattle numbers) on water
quality/sediment
- The relative ‘value’ of the goods and services provided by the Great Barrier Reef World
Heritage Area (GBRWHA) to residents of and visitors to the GBR Catchment area
(also provides an indication of whether market based policies are likely to be useful for NRM)