National Health Accounts NHA National Health Accounts-NHA National - - PowerPoint PPT Presentation

national health accounts nha national health accounts nha
SMART_READER_LITE
LIVE PREVIEW

National Health Accounts NHA National Health Accounts-NHA National - - PowerPoint PPT Presentation

Health sector in Bangladesh Health sector in Bangladesh B B Bangladesh National Health Accounts Bangladesh National Health Accounts l d l d h N ti h N ti l H l H lth A lth A t t Financing vs. performance 1997 2012 1997 1997 1997-


slide-1
SLIDE 1

B l d h N ti l H lth A t B l d h N ti l H lth A t Bangladesh National Health Accounts Bangladesh National Health Accounts 1997 1997-

  • 2012

2012 1997 1997 2012 2012

BNHA Cell BNHA Cell Health Economics Unit Ministry of Health and Family Welfare Ministry of Health and Family Welfare January 2015

Health sector in Bangladesh Health sector in Bangladesh

Financing vs. performance

  • Bangladesh Paradox: exceptional health

achievement despite economic poverty.

  • One of the great mysteries in global health
  • One of the great mysteries in global health
  • Unusual success
  • The Lancet Series Nov, 2013

The Lancet Series Nov, 2013

2

National Health Accounts NHA National Health Accounts-NHA

NHA is a statistical process that

identifies total health expenditure traces the sources of health expenditure traces the sources of health expenditure shows the distribution of funds by functions (prevention and curative services etc ) (prevention and curative services etc.) traces the channels of distribution of funds by i t ( & l i di i t ) inputs (pay & salaries, medicines etc.).

National Health Accounts NHA National Health Accounts-NHA

It tends to answer

How much is spent for health? Who pays, how much? p y , How the expenditures are distributed across different services ? different services ? Who is benefited how much ? (Income groups, regions diseases etc ) regions, diseases etc.)

slide-2
SLIDE 2

Guidelines Guidelines

NHA follows standard guidelines as it:

  • k

ti l i makes cross-national comparisons provides international validation saves time and cost There are similarities among national health There are similarities among national health systems where international standards can be applied pp It is partly customized to the national situation situation

Global Guidelines – evolving towards more precision evolving towards more precision NHA Frameworks over time

  • Pre 2000
  • No global framework
  • Ad-hoc national standards & international frameworks
  • Lack of comparability in international estimates
  • System of National Accounts (SNA)
  • System of National Accounts (SNA)
  • Not widely used for health

2000

  • OECD System of Health Accounts (SHA)
  • First global standard
  • Endorsed by WHO for international reporting

2011

f l h

  • System of Health Accounts 2011
  • Updated SHA
  • Agreed and adopted by OECD, Eurostat, WHO

g p y , ,

Features of SHA

Provides explicit and comprehensive boundary of health and health related production production Analyses health expenditure in three core dimensions: financing sources, providers dimensions: financing sources, providers and functions Detailed sets of classifications for the

roviders roviders

uses of spending: providers and functions Linkages with

  • ther

international l ifi ti i l di SNA

P

classifications including SNA Basis for adaption to meet specific national requirements

Functions Functions

national requirements

slide-3
SLIDE 3

International Classification of H lth E dit (ICHA) Health Expenditure (ICHA)

SHA 1.0

Health care by function (ICHA-HC) Health care by provider industry (ICHA-HP) Sources of health care financing (ICHA-HF)

SHA 2011

H lth b f ti (ICHA HC) Health care by function (ICHA-HC) Health care by provider industry (ICHA-HP) H lth fi i h (ICHA HF) Health financing schemes (ICHA-HF) Financing agents (ICHA-FA) Revenues of health financing schemes (ICHA FS) Revenues of health financing schemes (ICHA-FS)

Flow of Funds

Revenues of

Taka

Financing Schemes Revenues of Schemes

Taka

  • Government schemes
  • Voluntary health insurance

schemes

  • Non‐profit institution/NGO

financing schemes

  • Corporations autonomous

Providers

Health services and Functions

  • Corporations, autonomous

bodies and private companies (other than health insurance)

  • Out‐of‐pocket household

expenditure excluding cost‐sharing

Beneficiaries

(by age, sex, region, disease, income group)

  • Rest of the World

voluntary schemes

NHA i B l d h NHA in Bangladesh

First BNHA-conducted in 1998 (1996/ 97)

  • Financial assistance from ADB

Second BNHA in 2002 (1996/ 97 2001/ 02) Second BNHA- in 2002 (1996/ 97–2001/ 02)

Revised estimates for 1996/ 97 and new estimates for 1997/ 98 – 2001/ 02

  • Financial assistance from DFID

Third BNHA- in 2009 (1996/ 97–2007/ 08)

New estimates for 2002/ 03-2007/ 08 and revised for earlier years

  • Financial assistance from GIZ

Fourth NHA produced in 2014 (1996/ 97 2011/ 12) Fourth NHA- produced in 2014 (1996/ 97-2011/ 12)

New estimates for 2007/ 08-2011/ 12 and revised for earlier years

  • Support from Rockefeller Foundation, GIZ, WB, WHO

pp , , ,

Process undertaken for BHNA-IV

  • Preparation
  • P

i d f NHA d th h t i

  • Previous rounds of NHA done through outsourcing
  • Initiatives taken to institutionalize the process in HEU 2011

and costed action plan developed a d

  • d a
  • p a

d

  • p d
  • Three committees formed:
  • National Steering Committee

Stakeholder Coordination Committee

  • Stakeholder Coordination Committee
  • Technical Working Committee

BNHA Cell formed in July 2012 with representations y p from HEU, BBS, IHE, ICDDR-B and DI, support from WB Dhaka Office Working arrangements with Partners (BBS ICDDRB IHE Working arrangements with Partners (BBS, ICDDRB, IHE and DI) outlined through signing MoU in 2013 BNHA Cell received Hands on Training on SHA and NHA at IHP, Sri Lanka in September 2013

slide-4
SLIDE 4

Process undertaken for BHNA-IV

  • Data collection

Data collection from : Public & Non-Public sector Data collection instruments developed p Different Sampling frame developed for

  • Private clinics/ hospitals/ diagnostics survey
  • Private clinics/ hospitals/ diagnostics survey
  • Corporation survey (those have health expenditures)
  • NGO Survey

Insurance expenditure survey conducted through IDRA DP expenditure survey conducted through DP Consortium p y g Medicine expenditure from IMS & DGDA Household Income and Expenditure Survey from BBS

Data Sources : Public Sector Data Sources : Public Sector

BNHA Code BNHA Financing Schemes Source Data g BHF.1 Government schemes and compulsory health care financing schemes Controller General of MoHFWs’ expenditure BHF.1.1.1.1 MoHFW schemes Accounts (CGA), MoF Line Directors Office, MoHFW Spending at district and below Planning Wing, MoHFW RADP BHF.1.1.1.2 Government E l S h

  • Govt. Employees Welfare

Di t t M PA Reimbursement of t t t t Employees Schemes Directorate, MoPA treatment cost Non MoHFW Controller General of Accounts (CGA), MoF

  • ther Ministries’ health

expenditure BHF.1.1.1.3 Non‐MoHFW schemes M o D, M o H A, M o R, M o W & C A, M o S W, M o R A, M o C A & T Health Expenditure BHF.1.1.2 Local Government Schemes Mo L G R D & C City Corporation, Municipalities

Data Sources : Private Sector Data Sources : Private Sector

BNHA Code BNHA Financing Schemes Source Data g BHF.2 Voluntary health care payment schemes Insurance Development Insurance Companies BHF.2.1.2.2 Voluntary Health Insurance schemes and Regulatory Authority Survey Bangladesh Bureau of Statistics Household Income and Expenditure Survey p y Bangladesh National Accounts BHF.2.2.1 NIPISH/NGO BNHA Survey NGO Survey BHF.2.2.1 NIPISH/NGO financing scheme BNHA Survey NGO Survey BHF.2.3.1.1 Parastatal firms and corporations BNHA Survey Corporations and and corporations p Autonomous Bodies Survey BHF.2.3.1.2 Private firms and corporations BNHA Survey

Data Sources : Private Sector

BNHA BNHA BNHA Code BNHA Financing Schemes Source Data BHF.3 Households out‐of‐pocket payment BNHA Survey Private Hospital/Clinic/Diagnostic Survey B B S Household Income and Expenditure Survey Bangladesh National Accounts BHF.3.1 Out‐of‐pocket expenditure excluding cost h i B B S Bangladesh National Accounts Morbidity and Health Status Survey DGHS and DGFP User fee sharing IMS Pharmaceutical Survey DGDA, MoHFW Pharmaceutical‐Production, import, export NBR Tax VAT Excise duty NBR Tax‐VAT‐Excise duty BHF.4 Rest of the world health financing schemes (non‐resident) BNHA Survey NGO Survey BHF.4.2 Rest of the world voluntary schemes DP Consortium Development Partner Survey Planning Wing RADP y C G A / E R D D P Expenditure OECD D A C Data

slide-5
SLIDE 5

Data processing & analysis Data processing & analysis

Using data from multiple sources cross checking corroboration & validation checking, corroboration & validation Interpolation and extrapolation done in p p case of data gap Checking trends of various components and comparing them with National p g Accounts

Total Health Expenditure (THE) Total Health Expenditure (THE)

SHA 2011: Final consumption expenditure

  • f resident units on health care goods and

services Human capital (training, research) Human capital (training, research) and physical capital formation an investment, not included in SHA THE investment, not included in SHA THE Bangladesh National Health Accounts (BNHA) includes capital investment under (BNHA) includes capital investment under THE

THE Estimates BNHA 1997-2012 & Earlier Rounds

THE estimates under BNHA (million taka) Share of THE in GDP Year ( ) BNHA‐IV BNHA‐III BNHA‐II BNHA‐I 1997 46,356 48,699 55,763 54,698 BNHA‐IV BNHA‐III BNHA‐II BNHA‐I 2.57% 2.70% 3.09% 3.03% 2002 81,488 82,978 88,113 2007 153,887 160,899 2008 178 943 2.98% 3.04% 3.23% 3.26% 3.41% 3 28% 2008 178,943 2009 205,120 2010 244,331 3.28% 3.34% 3.52% 2010 244,331 2011 289,017 2012 325,094 3.52% 3.63% 3.54% Changes in estimates happened due to: ① Use of actual audited data ② Changes in estimation methods ③Changes in definition ② Changes in estimation methods ④ Better knowledge on all types of healthcare facilities

Per capita THE: BNHA and SHA

Year Per capita THE (BNHA 1997 – 2012)

Current (Taka) Constant (Taka) Real Growth Rate (%) Current (US $)

Per capita THE (SHA 2011)

Current (Taka) Constant (Taka) Real Growth Rate (%) Current (US $) (Taka) (Taka) Rate (%) (US $)

1997 379 826 9 2002 634 1,137 7.1 11

(Taka) (Taka) Rate (%) (US $)

364 792 9 581 1,075 9.5 10 2007 1,082 1.558 5.7 16 2008 1,245 1,647 5.7 18 1,004 1,447 8.0 16 1,126 1,490 3.0 16 1 284 1 595 7 1 19 2009 1,412 1,754 6.5 21 2010 1,663 1,940 10.6 24 2011 1 947 2 112 8 8 25 1,284 1,595 7.1 19 1,510 1,762 10.5 21 1,769 1,919 9.0 23 2011 1.947 2,112 8.8 25 2012 2,167 2,167 2.6 27 Average annual growth rate 1,769 1,919 9.0 23 2,028 2,028 5.6 25 Average annual growth rate 1998 ‐ 2002 501 974 6.7 10 2003 – 2007 849 1,350 6.6 13 476 924 6.3 9 788 1,255 6.2 12 2008 ‐ 2012 1,687 1,924 6.8 23 1998 ‐ 2012 1,012 1,416 6.7 15 1,544 1,759 7.0 21 936 1,313 6.5 14

slide-6
SLIDE 6

THE by Financing Schemes 2012 THE by Financing Schemes 2012 THE by Public and Private 1997-2012

Million Taka

  • As a share of THE declined during 1997 ‐ 2012
  • Public expenditure in nominal terms have increased every year

THE by Revenues of schemes 1997-2012 y

Transfers from government Voluntary prepayment Other domestic resources n e c Direct foreign transfers Total Health Expenditure Year government prepayment resources n.e.c. transfers Expenditure Million Taka Row% Million Taka Row% Million Taka Row% Million Taka Row% Million Taka 1997 17,064 37% 28 0.1% 26,614 57% 2,651 6% 46,356 2002 25,838 32% 49 0.1% 48,326 59% 7,276 9% 81,488 2007 41 730 27% 93 0 1% 100 370 65% 11 525 7% 153 718 2007 41,730 27% 93 0.1% 100,370 65% 11,525 7% 153,718 2008 45,580 25% 119 0.1% 119,927 67% 13,317 7% 178,943 2009 50,589 25% 174 0.1% 136,295 67% 17,317 8% 204,375 2010 62,737 26% 184 0.1% 161,769 66% 19,641 8% 244,331 2011 71,155 25% 195 0.1% 194,978 68% 22,314 8% 288,642 2012 75,071 23% 221 0.1% 222,657 68% 27,144 8% 325,054

  • Government share of THE declined from 37% in 1997 to 23% in 2012
  • Household OOP continue to be largest financer of THE
  • Development Partners contribution of THE 8% in 2012

THE by Financing agents 1997-2012 THE by Financing agents 1997 2012

  • Household followed by government is the major financing agent
slide-7
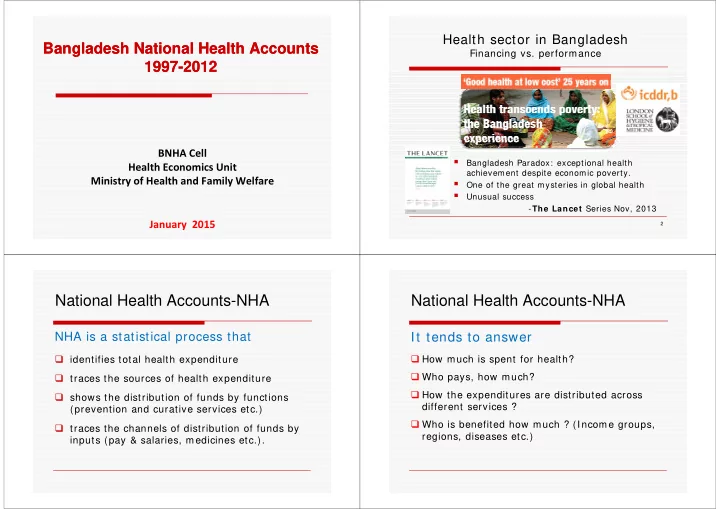
SLIDE 7

THE by BNHA Functional Classification 2012

  • Medical goods followed by curative care dominate expenditure by function

Medical goods followed by curative care dominate expenditure by function

Curative care services

Year eral tient tive care ialized tient tive care eral day tive care eral atient tive care al atient tive care ialized atient tive care curative Gene inpat curat Spec inpat curat Gene curat Gene

  • utp

curat Dent

  • utp

curat Spec

  • utp

curat Total care Million Taka % Million Taka % Million Taka % Million Taka % Million Taka % Million Taka % Million Taka 1977 3,971 38.1% 387 3.7% 332 3.2% 5,476 52.6% 59 0.6% 164 1.9% 10,419 2002 8,589 45.1% 848 4.5% 2 0.0% 9,146 48.0% 144 0.8% 325 1.7% 19,053 2007 19,130 51.1% 645 1.7% 8 0.0% 17,131 45.7% 301 0.8% 257 0.7% 37,472 2008 20,463 47.7% 870 2.0% 8 0.0% 20,848 48.6% 349 0.8% 347 0.8% 42,886 2009 24 123 47 6% 1 086 2 1% 10 0 0% 24 617 48 6% 407 0 8% 429 0 8% 50 672 2009 24,123 47,6% 1,086 2.1% 10 0.0% 24,617 48.6% 407 0.8% 429 0.8% 50,672 2010 27,994 47.6% 1,326 2.2% 491 0.8% 28,217 47.8% 478 0.8% 516 0.9% 59,021 2011 33,695 46.7% 1,924 2.7% 2,034 2.8% 33,116 45.9% 582 0.8% 738 1.0% 72,089 2012 38,697 46.3% 2,021 2.4% 3,170 3.8% 38,134 45.7% 699 0.8% 775 0.9% 83,495

  • Increase in inpatient curative

Increase in inpatient curative care expenditure over the years care expenditure over the years

  • Day curative

Day curative care services offered primarily by public sector, expenditure in care services offered primarily by public sector, expenditure in community clinics increased in community clinics increased in 2011 2011 and and 2012 2012 p p y p y

Expenditure on medical goods 1997 – 2012 Million Taka 1997 – 2012 Million Taka

d nd

  • n

ds dic s and s d ical Year Prescribed medicines Glasses an

  • ther visio

products Hearing ai Orthopaed appliances prosthetic excluding glasses an Total medi goods % of THE Y P m G

  • p

H O a p (e g T g % 1997 19,557 99.5% 89 0.5% 1 0.0% 1 0.0% 19,648 42.4% 2002 32,087 99.4% 184 0.6% 12 0.0% 3 0.0% 32,287 39.6% 2007 62,089 99.5% 256 0.4% 18 0.0% 14 0.0% 62.376 40.5% 2008 69,361 99.6% 239 0.3% 13 0.0% 16 0.0% 69,631 38.9% 2009 80,479 99.8% 223 0.3% 8 0.0% 22 0.0% 80,732 39.4% 2010 96,596 99.8% 206 0.2% 3 0.0% 26 0.0% 96,830 39.6% 2011 116 337 99 8% 197 0 2% 3 0 0% 25 0 0% 116 562 40 3% 2011 116,337 99.8% 197 0.2% 3 0.0% 25 0.0% 116,562 40.3% 2012 133,794 99.8% 189 0.1% 2 0.0% 24 0.0% 134,009 41.2%

  • Expenditure on medicine comprise almost

Expenditure on medicine comprise almost 100 100% of medical goods category % of medical goods category

  • Expenditure on medicine comprise almost

Expenditure on medicine comprise almost 100 100% of medical goods category % of medical goods category

THE by Provider classification 2012

  • Drug retailers, hospitals and ambulatory care major expenditures

Drug retailers, hospitals and ambulatory care major expenditures

slide-8
SLIDE 8

THE by Provider classification 1997‐2012

Hospitals as provider 1997-2012

Year General hospitals including teaching hospitals Mental health and substance abuse hospitals Specialized hospitals Total hospital Million Taka Row % Million Taka Row % Million Taka Row % Million Taka 1997 8,848.38 84.1% 5.38 0.1% 1,672.05 15.9% 10,525.80 2002 18,289.19 82.0% 5.55 0.1% 2,473.50 11.9% 20,782.57 2007 40,665,86 92.0% 28.81 0.1% 3,498.69 7.9% 44,193.37 2008 52 993 24 92 0% 24 42 0 0% 4 572 78 7 9% 57 590 43 2008 52,993.24 92.0% 24.42 0.0% 4,572.78 7.9% 57,590.43 2009 58,993.44 91.7% 33.93 0.1% 5,281.20 8.2% 64,308.57 2010 69,772.76 91.9% 41.74 0.1% 6,084.21 8.0% 75,898.72 2011 82,671.13 89.8% 53.75 0.1% 9,372.55 10.2% 92,097.43 2012 88,172.98 90.1% 58.21 0.1% 9,594.17 9.8% 97,825.36

  • Decline in share of Specialized Hospital services suggest General Hospitals also

Decline in share of Specialized Hospital services suggest General Hospitals also

  • General Hospitals including Medical College Hospitals account for major portion

General Hospitals including Medical College Hospitals account for major portion

  • f hospital services
  • f hospital services

p p gg p p p gg p

  • ffering specialized services
  • ffering specialized services

P bli h lth 1997 2012 Public health programmes 1997-2012

Year GoB MoHFW public health programmes GoB non‐MoHFW public health programmes NGO public health programmes Total public health programmes p g

Million Taka Row % Million Taka Row % Million Taka Row % Million Taka

1997 4,448 71.8% 30 0.5% 1,714 27.7% 6,192 2002 1,205 14.6% 31 0.4% 6,997 85.0% 8,233 2007 2,304 39.9% 40 0.7% 3,426 59.4% 5,770 2008 5 117 82 3% 75 1 2% 1 025 16 5% 6 217 2008 5,117 82.3% 75 1.2% 1,025 16.5% 6,217 2009 4,758 75.5% 232 3.7% 1,316 20.9% 6,306 2010 6,139 83.1% 111 1.5% 1,140 15.4% 7,391 2010 6,139 83.1% 111 1.5% 1,140 15.4% 7,391 2011 5,545 76.6% 127 1.8% 1,566 21.6% 7,236 2012 6,050 82.0% 61 0.8% 1,269 17.2% 7,380

  • MoHFW

MoHFW is the major is the major provider of public health services provider of public health services

  • NGO share declined in recent years

NGO share declined in recent years

Share of THE by Division 2012 y

  • Dhaka Division accounts for largest share of THE;

Dhaka Division accounts for largest share of THE; Sylhet Sylhet smallest smallest

slide-9
SLIDE 9

Per capita THE by Division 2012

  • Per capita THE highest in Dhaka division; lowest in

Per capita THE highest in Dhaka division; lowest in Sylhet Sylhet

Per capita THE by Division 1997 2012 BDT k 1997 – 2012 BDTaka

Year Dhaka Chittagong Rajshahi Khulna Barisal Sylhet Rangpur 1997 349 527 382 357 277 381 283 2002 632 705 580 554 604 692 470 2002 632 705 580 554 604 692 470 2007 1,187 1,183 994 1,036 998 1,004 845 2008 1,484 1,294 1,059 1,207 1,024 1,085 939 2008 1,484 1,294 1,059 1,207 1,024 1,085 939 2009 1,658 1,411 1,230 1,445 1,163 1,135 1,182 2010 2,002 1,622 1,466 1,721 1,378 1,164 1,373 2011 2,390 1,857 1,729 2,065 1,631 1,265 1,520 2012 2,722 1,930 1,886 2,371 1,827 1,379 1,732

h k di i i h d h hi h i di f ll d b h l & h k di i i h d h hi h i di f ll d b h l &

  • During the period

During the period 1997 1997 – 2006 2006 Chittagong division had the highest per capita Chittagong division had the highest per capita

  • Dhaka division had the highest per capita spending followed by Khulna &

Dhaka division had the highest per capita spending followed by Khulna & Chittagong, while Chittagong, while Sylhet Sylhet had t had the lowest per capita spending. he lowest per capita spending. spending. spending.

  • Barisal,

Barisal, Rangpur Rangpur and and Sylhet Sylhet had relatively lower per capita expenditure than the had relatively lower per capita expenditure than the

  • ther four divisions.
  • ther four divisions.

Share of OOPS by Functions 2012 Share of OOPS by Functions 2012

  • Two out of three Taka spent on medicine

Two out of three Taka spent on medicine

OOPS by Function 1997 - 2012

  • Households spending less (as percent of total OOP) on medicine compared to

Households spending less (as percent of total OOP) on medicine compared to 1997 1997

slide-10
SLIDE 10

OOPS by Providers 2012

  • Retail drug outlets was the largest provider in

Retail drug outlets was the largest provider in 2012 2012

Regional comparison: Expenditure g p p and selected Indicators

Indicator gladesh hutan ndia anmar epal kistan Lanka Bang Bh In Mya N Pak Sri Per capita THE $ 27 $ 90 $ 61 $ 20 $ 36 $ 39 $ 89 THE as % of GDP 3.5% 3.8% 4.0% 1.8% 5.5% 3.1% 3.1%

  • Pub. Exp. as % of THE

23.1% 83.9% 33.1% 23.9% 39.5% 31.4% 39.8% Life Expectancy at birth (yrs) 70 68 66 66 68 66 74 Infant Mortality Rate 33 30 41 41 32 69 08 Under 5 Mortality Rate 41 38 53 51 40 86 10 Maternal Mortality Rate 170 120 190 200 190 170 29 a e a

  • a y a e

90 00 90 9 Contraceptive Prevalence Rate 61% 66% 55% 46% 50% 27% 68%

Source: WB, WHO

f Major findings

BNHA-IV provides detailed healthcare expenditure for 1997-2012 Health expenditure increasing both in nominal and real terms Private expenditure as share of THE increasing while public expenditure share has declined Household OOP dominates THE, expenditure on drugs by households as % share declining

ff How BHNA-IV is different ?

  • P
  • Process
  • BNHA-IV conducted & steered by BNHA Cell
  • Collaborative effort-HEU, BBS, IHE, ICDDRB & DI and World Bank
  • Data capturing – m ore w ide & accurate
  • Audited health expenditure data for all ministries - CGA
  • Total Insurance expenditure survey - IDRA
  • a

u a p d u u y

  • Total DP expenditure survey – Chair, DP Consortium
  • Uses a complete list of Private Clinics/ Diagnostics for Private

Clinic/ Diagnostics Survey Clinic/ Diagnostics Survey

  • Outcom e
  • Estimates more reliable and complete than earlier NHA rounds as

well as SHA 2011 compatible well as SHA 2011 compatible

  • More comprehensive health expenditure information
  • Adopts SHA 2011 for dual reporting
  • O

t f d t d i tit ti li ti

  • One step forw ard tow ards institutionalization
slide-11
SLIDE 11

Thank You Thank You