
SLIDE 1
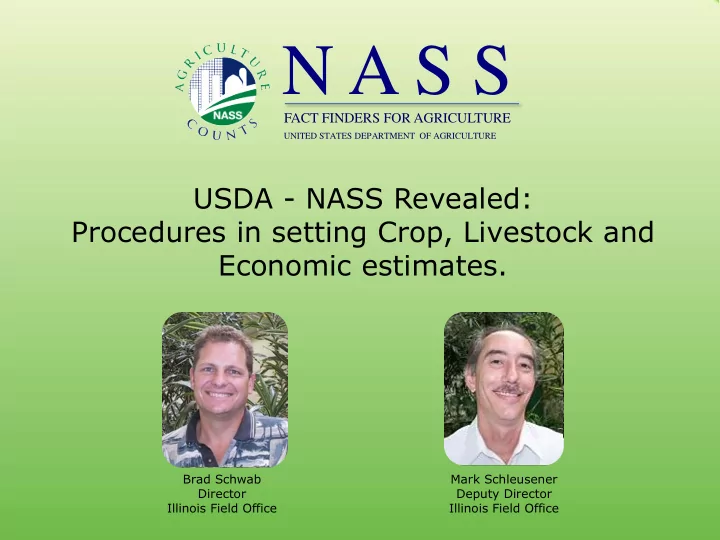
USDA - NASS Revealed: Procedures in setting Crop, Livestock and Economic estimates.
Brad Schwab Director Illinois Field Office Mark Schleusener Deputy Director Illinois Field Office
N A S S
FACT FINDERS FOR AGRICULTURE
UNITED STATES DEPARTMENT OF AGRICULTURE