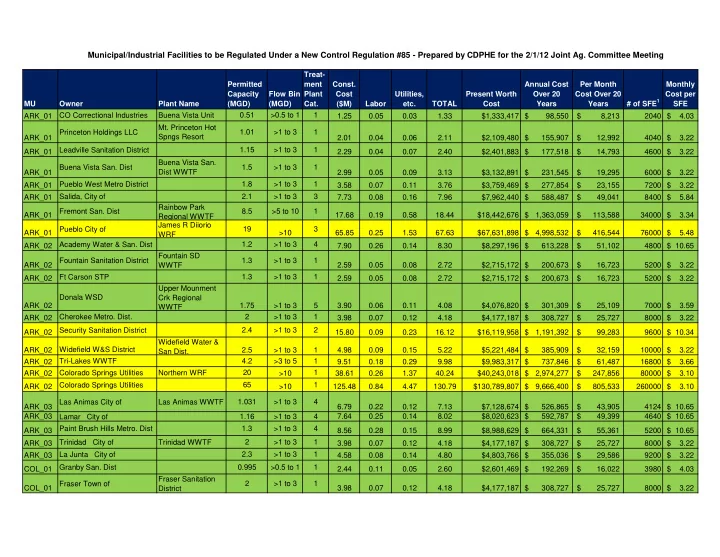

Municipal/Industrial Facilities to be Regulated Under a New Control Regulation #85 - Prepared by CDPHE for the 2/1/12 Joint Ag. Committee Meeting
MU Owner Plant Name Permitted Capacity (MGD) Flow Bin (MGD) Treat- ment Plant Cat. Const. Cost ($M) Labor Utilities, etc. TOTAL Present Worth Cost Annual Cost Over 20 Years Per Month Cost Over 20 Years # of SFE1 Monthly Cost per SFE ARK_01 CO Correctional Industries Buena Vista Unit 0.51 >0.5 to 1 1 1.25 0.05 0.03 1.33 $1,333,417 98,550 $ 8,213 $ 2040 4.03 $ ARK_01 Princeton Holdings LLC
- Mt. Princeton Hot
Spngs Resort 1.01 >1 to 3 1 2.01 0.04 0.06 2.11 $2,109,480 155,907 $ 12,992 $ 4040 3.22 $ ARK_01 Leadville Sanitation District 1.15 >1 to 3 1 2.29 0.04 0.07 2.40 $2,401,883 177,518 $ 14,793 $ 4600 3.22 $ ARK_01 Buena Vista San. Dist Buena Vista San. Dist WWTF 1.5 >1 to 3 1 2.99 0.05 0.09 3.13 $3,132,891 231,545 $ 19,295 $ 6000 3.22 $ ARK_01 Pueblo West Metro District 1.8 >1 to 3 1 3.58 0.07 0.11 3.76 $3,759,469 277,854 $ 23,155 $ 7200 3.22 $ ARK_01 Salida, City of 2.1 >1 to 3 3 7.73 0.08 0.16 7.96 $7,962,440 588,487 $ 49,041 $ 8400 5.84 $ ARK_01 Fremont San. Dist Rainbow Park Regional WWTF 8.5 >5 to 10 1 17.68 0.19 0.58 18.44 $18,442,676 1,363,059 $ 113,588 $ 34000 3.34 $ ARK_01 Pueblo City of James R Diiorio WRF 19 >10 3 65.85 0.25 1.53 67.63 $67,631,898 4,998,532 $ 416,544 $ 76000 5.48 $ ARK_02 Academy Water & San. Dist 1.2 >1 to 3 4 7.90 0.26 0.14 8.30 $8,297,196 613,228 $ 51,102 $ 4800 10.65 $ ARK_02 Fountain Sanitation District Fountain SD WWTF 1.3 >1 to 3 1 2.59 0.05 0.08 2.72 $2,715,172 200,673 $ 16,723 $ 5200 3.22 $ ARK_02 Ft Carson STP 1.3 >1 to 3 1 2.59 0.05 0.08 2.72 $2,715,172 200,673 $ 16,723 $ 5200 3.22 $ ARK_02 Donala WSD Upper Mounment Crk Regional WWTF 1.75 >1 to 3 5 3.90 0.06 0.11 4.08 $4,076,820 301,309 $ 25,109 $ 7000 3.59 $ ARK_02 Cherokee Metro. Dist. 2 >1 to 3 1 3.98 0.07 0.12 4.18 $4,177,187 308,727 $ 25,727 $ 8000 3.22 $ ARK_02 Security Sanitation District 2.4 >1 to 3 2 15.80 0.09 0.23 16.12 $16,119,958 1,191,392 $ 99,283 $ 9600 10.34 $ ARK_02 Widefield W&S District Widefield Water & San Dist. 2.5 >1 to 3 1 4.98 0.09 0.15 5.22 $5,221,484 385,909 $ 32,159 $ 10000 3.22 $ ARK_02 Tri-Lakes WWTF 4.2 >3 to 5 1 9.51 0.18 0.29 9.98 $9,983,317 737,846 $ 61,487 $ 16800 3.66 $ ARK_02 Colorado Springs Utilities Northern WRF 20 >10 1 38.61 0.26 1.37 40.24 $40,243,018 2,974,277 $ 247,856 $ 80000 3.10 $ ARK_02 Colorado Springs Utilities 65 >10 1 125.48 0.84 4.47 130.79 $130,789,807 9,666,400 $ 805,533 $ 260000 3.10 $ ARK_03 Las Animas City of Las Animas WWTF 1.031 >1 to 3 4 6.79 0.22 0.12 7.13 $7,128,674 526,865 $ 43,905 $ 4124 10.65 $ ARK_03 Lamar City of 1.16 >1 to 3 4 7.64 0.25 0.14 8.02 $8,020,623 592,787 $ 49,399 $ 4640 10.65 $ ARK_03 Paint Brush Hills Metro. Dist 1.3 >1 to 3 4 8.56 0.28 0.15 8.99 $8,988,629 664,331 $ 55,361 $ 5200 10.65 $ ARK_03 Trinidad City of Trinidad WWTF 2 >1 to 3 1 3.98 0.07 0.12 4.18 $4,177,187 308,727 $ 25,727 $ 8000 3.22 $ ARK_03 La Junta City of 2.3 >1 to 3 1 4.58 0.08 0.14 4.80 $4,803,766 355,036 $ 29,586 $ 9200 3.22 $ COL_01 Granby San. Dist 0.995 >0.5 to 1 1 2.44 0.11 0.05 2.60 $2,601,469 192,269 $ 16,022 $ 3980 4.03 $ COL_01 Fraser Town of Fraser Sanitation District 2 >1 to 3 1 3.98 0.07 0.12 4.18 $4,177,187 308,727 $ 25,727 $ 8000 3.22 $