
SLIDE 1
Mudrick Capital Acquisition Corporation & Hycroft Mining - - PowerPoint PPT Presentation
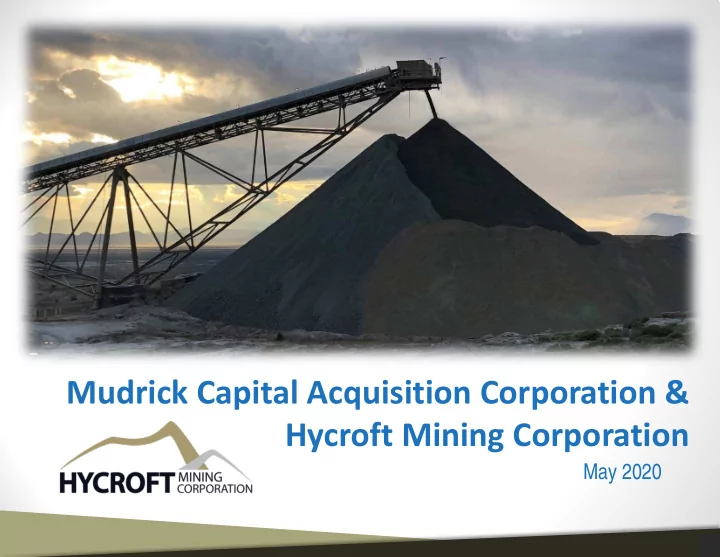
Mudrick Capital Acquisition Corporation & Hycroft Mining Corporation May 2020 0 0 Important Information This presentation (the Presentation) has been prepared solely for, and is being delivered on a confidential basis to, persons
1
1
This presentation (the “Presentation”) has been prepared solely for, and is being delivered on a confidential basis to, persons considering a possible business relationship with Hycroft Mining Corporation (“Hycroft” or the “Company”) in connection with the proposed business combination with Mudrick Capital Acquisition Corporation (“Mudrick”). This Presentation is for informational purposes only. The information herein may not be reproduced, further distributed to any other person or published, in whole or in part, for any purpose whatsoever. Financial Projections This presentation contains financial forecasts regarding certain financial metrics of the Company. Neither the independent auditors of the Company or Mudrick have audited, reviewed, compiled, or performed any procedures with respect to the projections for the purpose of their inclusion in this Presentation, and accordingly, neither of them expressed an opinion or provided any other form of assurance with respect thereto for the purpose of this presentation. These projections should not be relied upon as being necessarily indicative of future results. Neither Mudrick nor Hycroft undertakes any commitment to update or revise the projections, whether as a result of new information, future events, or otherwise. In this presentation, certain of the above-mentioned projected information has been repeated (in each case, with an indication that the information is an estimate and is subject to the qualifications presented herein), for purposes of providing comparisons with historical data. The assumptions and estimates underlying the prospective financial information are inherently uncertain and are subject to a wide variety of significant business, economic, and competitive risks and uncertainties that could cause actual results to differ materially from those contained in the prospective financial
those presented in the prospective financial information. Inclusion of the prospective financial information in this presentation should not be regarded as a representation by any person that the results contained in the prospective financial information will be achieved. Cautionary Note Regarding Forward-Looking Statements In addition to historical information, this presentation and the documents incorporated by reference in this presentation and other written reports and oral statements made from time to time by us may contain forward-looking statements. All statements, other than statements of historical fact, included herein or incorporated by reference, that address activities, events or developments that we expect or anticipate will or may occur in the future, are forward-looking statements. Generally, these forward-looking statements can be identified by the use of forward-looking terminology such as “estimate”, “plan”, “anticipate”, “expect”, “intend”, “believe”, “project”, “target”, “budget”, “may”, “can”, “will”, “would”, “could”, “should”, “seeks”, or “scheduled to”, or other similar words, or negatives of these terms or other variations of these terms or comparable language or any discussion of strategy or intentions. Forward-looking statements address activities, events or developments that the Company expects or anticipates will or may occur in the future and are based on current expectations and assumptions. These statements involve known and unknown risks, uncertainties, assumptions and other factors which may cause our actual results, performance or achievements to be materially different from any results, performance or achievements expressed or implied by such forward-looking statements, and include, but are not limited to the time and cost of construction and operation of existing and new leach pads; the feasibility and efficacy of processing sulfide ores using a pre-oxidation and heap leach process; the effectiveness and control of the oxidation process; the processing and production of gold and silver from the heap leach pads; the availability of personnel and equipment to operate the mine; the future price of gold and silver; the timing and amount of estimated future production, costs of production, capital expenditures and requirements for additional capital; cash flow provided by operating activities before changes in working capital; government regulation of mining operations; environmental risks; unanticipated reclamation expenses; title disputes or claims and limitations on insurance coverage; total cash cost per ounce, total cash cost net of by-product per ounce, all-in sustaining cost per ounce, capital expenditures, corporate general and administration expenses; sustaining and project capital expenditures; the expected working capital requirements; the sufficiency of capital resources and the availability of additional funding as and when required to meet operational and strategic needs; the expected depreciation and depletion rates; changes in mining laws and regulations; the uncertainty in the estimation of mineral resource and mineral reserve estimates; the cost and timing of sustaining capital projects; the uncertainty in geologic, hydrological, metallurgical and geotechnical studies and opinions; infrastructure risks, including access to water and power; the expectation of meeting production targets; the expected timeline for achieving mining rates, oxidation rates and percentage recoveries included in the Hycroft Technical Report; projected net present values and internal rates of return under the Hycroft Technical Report; risks associated with competition; contractor, labor and employment risks; the adverse effects of COVID-19 on our business and dependence on key management personnel and executives . Although the Company has attempted to identify important factors that could cause actual results, performance or achievements to differ materially from those described in forward-looking statements, there may be other factors that cause results, performance or achievements not to be as anticipated, estimated or intended. There can be no assurance that such statements will prove to be accurate, as actual results, performance and achievements and future events could differ materially from those anticipated in such statements. Accordingly, readers should not place undue reliance on forward-looking statements. Further, the financial and other projections are preliminary and subject to change. The Company undertakes no
applicable law. Projections are inherently subject to substantial and numerous uncertainties and to a wide variety of significant business, economic and competitive risks, and the assumptions underlying the projections may be inaccurate. Therefore, the actual results achieved may vary significantly from the forecasts, and the variations may be material. All dollar amounts are expressed in US dollars, unless otherwise stated.
2
2
No Representations or Warranties This presentation does not purport to contain all of the information that may be required to evaluate a possible transaction. No representation or warranty, express or implied, is or will be given by Mudrick or Hycroft or any of their respective affiliates, directors, officers, employees, or advisers or any other person as to the accuracy or completeness of the information in this presentation (including as to the accuracy or reasonableness of statements, estimates, targets, projections, assumptions, or judgments) or any other written, oral, or other communications transmitted or otherwise made available to any party in the course of its evaluation of a possible transaction, and no responsibility or liability whatsoever is accepted for the accuracy or sufficiency thereof or for any errors, omissions,
Accordingly, none of Mudrick or Hycroft or any of their respective affiliates, directors, officers, employees, or advisers or any other person shall be liable for any direct, indirect, or consequential loss or damages suffered by any person as a result of relying on any statement in or omission from this presentation and any such liability is expressly disclaimed. This presentation is not intended to constitute and should not be construed as investment advice and does not constitute investment, tax, or legal advice. Certain information contained herein has been derived from sources prepared by third
Industry and Market Data In this presentation, Mudrick and Hycroft rely on and refer to information and statistics regarding Hycroft and certain of its competitors and other industry data. The information and statistics are from third-party sources, including reports by market research firms. Additional Information and Where to Find It In connection with the proposed business combination, Mudrick has filed with the Securities and Exchange Commission (the “SEC”) a Joint Proxy Statement/Prospectus for Special Meeting of Mudrick Capital Acquisition Corporation and Hycroft Mining Corporation, dated and effective as of May 7, 2020 (the “Prospectus”), which includes a proxy statement/prospectus with respect to the securities to be issued in connection with the transactions contemplated by the proposed business combination. The Prospectus contains important information about the transactions contemplated by the proposed business combination and related matters. INVESTORS AND SECURITY HOLDERS OF MUDRICK AND HYCROFT ARE URGED AND ADVISED TO CAREFULLY READ THE PROSPECTUS. The Prospectus and other relevant materials and any other documents filed by Mudrick with the SEC may be obtained free of charge at the SEC’s website, at www.sec.gov. In addition, shareholders will be able to obtain free copies of the Prospectus by directing a request to: Mudrick Capital Acquisition Corporation, 527 Madison Avenue, 6th Floor, New York, NY 10022 or by email at info@mudrickcapital.com. Participants in the Solicitation Mudrick and its directors and executive officers may be deemed to be participants in the solicitation of proxies from Mudrick’s stockholders in connection with the proposed business combination. Information about Mudrick’s directors and executive officers is set forth in Mudrick’s Annual Report on Form 10-K for the fiscal year ended December 31, 2019, which was filed with the SEC on March 12,
York, NY 10022 or by email at info@mudrickcapital.com. Information regarding the persons who may, under SEC rules, be deemed participants in the solicitation of proxies to Mudrick stockholders in connection with the proposed business combination will be set forth in the Registration Statement for the proposed business combination when available. Additional information regarding the interests
No Offer or Solicitation This presentation is for informational purposes only and is neither an offer to purchase, nor a solicitation of an offer to sell, subscribe for or buy any securities or the solicitation of any vote in any jurisdiction pursuant to the proposed business combination or otherwise, nor shall there be any sale, issuance or transfer or securities in any jurisdiction in contravention of applicable law. No offer of securities shall be made except by means of a prospectus meeting the requirements of Section 10 of the Securities Act of 1933, as amended.
3
3
Randy Buffington Executive Chairman, President and Chief Executive Officer
Over 28 years of management, operations, engineering, and construction experience through various senior positions at globally focused mid-tier and senior mining companies
Randy has spent over 6 years at Hycroft and its predecessor, Allied Nevada
Most recently at Coeur d’Alene Mines Corporation, where Randy was Senior VP, Operations and was responsible for the safe
Argentina, Mexico, and the United States
Prior to that, Randy served in a variety of general management roles with Barrick Gold, including: Managing Director of Barrick’s Lumwana copper mine in Zambia, General Manager of Barrick’s Goldstrike mine complex, and General Manager of its Ruby Hill and Bald Mountain mines in Nevada
Randy has a Masters degree in Civil Engineering
Stephen Jones Executive Vice President and Chief Financial Officer
Over 20 years of management, marketing and finance experience at globally focused mid-tier and senior mining and oil & gas companies
Steve has spent over 7 years at Hycroft and its predecessor, Allied Nevada
Prior to Hycroft, Stephen was the President, CFO and Director of EPM Mining Ventures for which he raised the initial project funding as well as Senior VP and CFO for Katanaga Mining from 2006 to 2008 where he raised ~$300 mm through various debt and equity financing instruments enabling the restart of underground and open-pit mines in the DRC
Other previous roles include Managing Director of El Paso in the oil & gas sector and Senior VP and CFO of Freeport McMoRan Copper and Gold
Steve holds his B.B.A. in Finance from Texas A&M University and is a CPA
4
4
Source: Hycroft Mining Management, company filings 1. Resources include Measured, Indicated and Inferred Resources, AuEq calculated using a Au:Ag ratio of 75:1. $1,300 Au / $17.33 Ag, see “Cautionary Note Regarding Forward-Looking Statements” section. 2. See “Cautionary Note to US Investors Regarding Reserves and Resources.” 3. Free Cash Flow (“FCF”) is a non-GAAP financial measure, see “Cautionary Note on Non-GAAP Financial Measures” section. 4. Based on August 2019 Feasibility Study (effective date of July 31, 2019), using sales prices per ounce of
Hycroft Mining is a production stage gold and silver mining company operating the Hycroft Mine
Open pit heap leach mining operation located 54 miles west of Winnemucca, Nevada
One of the world’s largest deposits with a resource of ~31 Moz Au Eq(1,2)
Proven and probable mineral reserves of ~18 Moz Au Eq(1,2)
Low-capital expansion plans provide optionality and cumulative mine site FCF(3)
The Company has recently restarted operations
Secured funding from current investors for the restart of the operation
Weekly doré sales and metal pours since August 2019
Commissioned crushing system with manufacturer
5
5
Source: August 2019 Feasibility Study (effective date of July 31, 2019) 1. Based on 34 years of mining and processing mineral reserves. See “Cautionary Note to US Investors Regarding Reserves and Resources” and 2. Patent pending. 3. Based on leach pad Cell 1 results to date of Brimstone ore. “Cautionary Note Regarding Forward-Looking Statements”.
Senior-scale asset with expected average annual production of approximately 366 koz Au Eq.(1)
Management has developed a “capital light” restart plan that is being executed over 2019, 2020 and early 2021 after which the mine will be ramped up to Feasibility Study production levels
Currently mining stockpiles and in-pit drill and blast tons
Hycroft has fully constructed mine and processing facilities
Crusher commissioning completed
All operating and environmental permits are in place for initial mining and heap leach operations, with EIS recently approved
Proprietary process(2) oxidizes sulfides prior to leaching
Successful recoveries in excess of 80% have been demonstrated(3)
70 164 190 196 238 202 203 361 231 266 25 35 105 77 111 112 123 161 171 187 95 199 295 273 349 314 326 522 402 453 $1,243 $792 $532 $847 $629 $799 $644 $326 $483 $372 2020 2021 2022 2023 2024 2025 2026 2027 2028 2029 Au Production (koz) Ag Production (koz Au Eq.) By-Product AISC ($/oz)
Location Nevada, USA Stage Ramp up / Production Mine Type Open Pit Process Description Heap Leach Gold Reserves
(k oz)
11,996 Silver Reserves
(k oz)
481,399 AuEq Reserves
(k oz)
18,413 Metal Prices Inputs for Reserves
($ oz)
$1,200 / $16.50 First Gold Aug-19 Mine Life
(years)
34 Strip Ratio
(ratio)
1.17 Operating Cost
($ / ton)
$8.54 LOM Ore Processed
(kt)
1,133,060 Gold / Silver Recovery
(%)
65% / 71% LOM Payable Gold Production
(k oz)
7,845 LOM Payable Silver Production
(k oz)
344,097 LOM Payable AuEq Production
(k oz)
12,432 After-Tax NPV 5%
($ mm)
$2,078 IRR
(%)
147% After-Tax Payback
(years)
2.6 Initial 5-YR Capital Costs
($ mm)
$225 LOM Total Sustaining Capital
($ mm)
$533 Gold / Silver Price Assumptions
($ oz)
$1,300 / $17.33
Asset Details Operating Details Financial Details August 2019 Feasibility Study (Preliminary Draft)
6
6
18 million ounces of gold equivalent reserves 31 million ounces of gold equivalent resources
Initial capex (years 1 and 2) only 3% of NPV; initial 5-year capital expenditures forecast at $225 mm $400 mm of existing infrastructure - includes crushers, Merrill Crowe facilities, refinery, 4-bay truck shop, mine office, electrical and water utilities
Technical report forecasts average recoveries of 65% gold and 71% silver 50,000 ton leach pads demonstrate commercial scale recoveries in excess of those used in the technical report
$2.1 bn NPV5% using $1,300 / oz Au; $17.33 / oz Ag; NPV5% in excess of $3 bn at current spot prices Every $100 / oz change in Au is $300 mm of NPV5% Every $1.00 / oz change in Ag is $125 mm of NPV5%
Median Junior Producer Trading P/NAV Multiple - 0.65x Offer of equity is at 0.28x P/NAV
Producing gold since August 2019 Averaged over 500,000 tons placed on the leach pads monthly between July 2019 and April 2020 Expect to increase to 700,000 tons in May 2020 and 850,000 tons per month in Q4
7
7
Source: August 2019 Feasibility Study (effective date of July 31, 2019), Company filings, Fraser Institute, SNL, street research 1.
2. See “Cautionary Note to US Investors Regarding Reserves and Resources.” 3. Presents gold and gold equivalent silver ounces converted at LT street consensus pricing of $1,350/oz Au and $17.75/oz Ag. 4. Lower risk denotes a Fraser Institute Policy Perception Index score above 75; mid risk indicates a Policy Perception Index score between 50 and 75; higher risk indicates a Policy Perception Index score below 50.
Hycroft ranks among the 25 largest gold deposits in the world based on resource size, and the second largest in the U.S.
34-year mine life provides strong leverage to gold and silver prices, with expected production approximately 366 payable gold equivalent koz per year, including an average of over 10 moz Ag annually
Potential resource conversion provides additional production upside and mine life extension
Substantial scale will appeal to senior producers once project has demonstrated economics / production success
40 60 80 100 120
Kisladag (Eldorado) New Prosp. (Taseko) Mineracao (AngloGold) Los Filos (LeaGold)
Jeanette (Taung) Ahafo (Newmont) Yanacocha (Newmont) Kibali (AU/ABX) Boddington (Newmont) Driefontein (Sibanye) Blagodatnoye (Polyus) RMGC (Gabriel) Far South. (Gold Fields) Penasquito (Newmont) Detour Lake (Detour) Porcupine (Newmont) Elang-Dodo (Nusa)
Tshepong (Harmony) Metates (Chesapeake)
La Colosa (AngloGold) Evander (Pan African) Pueblo Viejo (Barrick) Kloof (Sibanye) Hycroft (Hycroft) Armgold (China African) Pascua-Lama (Barrick) Natalka (Polyus) Obuasi (AngloGold) Cadia East (Newcrest) Snowfield (Pretium) Olimpiada (Polyus) Donlin (Barrick) Mponeng (AngloGold) Muruntau (Navoi) Lihir (Newcrest) Siembra (Gold Reserve)
Sukhoi Log (Polyus)
Nevada (ABX/NEM) KSM (Seabridge) Higher Risk Jurisdiction Mid Risk Jurisdiction Lower Risk Jurisdiction
31 Moz
Tons Category (000s) Au Ag Au Ag Au Eq Proven & Probable 1,133,061 0.011 0.425 11,996 481,399 18,413 Measured & Indicated 393,922 0.009 0.277 3,699 108,992 5,152 Inferred 599,062 0.010 0.217 5,769 129,754 7,499 M&I + I 992,984 0.010 0.240 9,468 238,746 12,651 Grades Contained Ounces (000s)
Property Tons Au Ag AuEq Au Ag AuEq Round Mountain 231,116 0.021 0.013 0.022 4,949 3,028 4,989 Bald Mountain 268,390 0.017
4,641
Marigold 407,960 0.014
5,660
Hycroft 393,922 0.009 0.277 0.013 3,699 108,992 5,152 Paracatu 946,032 0.012
10,951
Fort Knox 466,424 0.010
4,833
Coeur Rochester 440,574 0.003 0.400 0.008 1,138 176,054 3,486 Grade Contained Ounces
8
8
$550 $579 $657 $678 $681 $694 $732 $751 $763 $791 $820 $870 $913 $1,000 $1,033 Hycroft (LOM) New Gold Torex Wesdome SSR Mining Resolute Victoria Pretium Galiano Golden Star Perseus Argonaut Equinox Harte Gold Superior Gold Median 2020E Total Cash Costs: $757 $/oz Au
694 444 429 379 366 362 353 285 280 189 185 119 97 84 45 Equinox Torex SSR Mining Resolute Hycroft (LOM) New Gold Pretium Argonaut Perseus Victoria Golden Star Galiano Wesdome Superior Gold Harte Gold Median 2020E Production: 282 koz Au Eq.
(1) (1)
Source: Company filings, street research Note: Estimates as at Feb-2020 to illustrate peers pre-Covid figures; Medians exclude Hycroft; Equinox shown pro forma acquisition of Leagold and Argonaut shown pro forma acquisition of Alio. 1. Based on the life of mine average from Hycroft’s 2019 feasibility study. 2. By-product cash costs is a non-GAAP financial measures, see “Cautionary Note on Non-GAAP Financial Measures” section.
All figures in US$
Hycroft Co-Product Total Cash Costs: ~$827/oz Au Eq.
9
9
$132 mm $65 mm $13 mm $10 mm
Source: Company filings, Sprott Credit Agreement Note: Current cash balance excluded from sources and uses.
New External
Financing
Sprott Resource Lending 1.5% NSR Proceeds to
ramp-up mine
feasibility study production levels NSR Term Loan Equity Ramp-Up (Projects and W/C)
$150 mm of total
debt post- transaction with no cash service in YR1 Debt Repayment
Funding from the SPAC / PIPE in excess of $110 mm: first $10 mm held on balance sheet, additional proceeds repurchase shares Committed Financing
$25 mm from Mudrick
Equity
All figures in US$
Proceeds will
fund first 3 years
mine ramp up at a gold price of $1,500/oz Transaction Costs
$70 mm $30 mm $25 mm $85 mm $10 mm
10
10 All figures in US$
Source: Company filings, FactSet, S-4, street research Note: Priced to 17-Apr-20. 1. Based on Hycroft implied post transaction 50 mm basic shares outstanding and NAV of $1.8 bn adjusted from Hycroft’s 2019 feasibility study.
Key Metrics Implied Share Price
Implied Purchase Multiple
Multiple
1.04x 1.03x 1.01x 0.75x 0.73x 0.71x 0.65x 0.65x 0.60x 0.55x 0.54x 0.52x 0.36x 0.34x Wesdome Pretium SSR Mining Equinox Galiano Resolute Torex Perseus Golden Star New Gold Superior Victoria Argonaut Harte
Median Peer Multiple: 0.65x Hycroft Multiple: 0.28x
11
11 Components Build-Up ($ mm) Hycroft NPV $1,994 Pro Forma Debt: SRL Debt ($70) New Note ($80) Cash $65 LOM Discounted Corp. G&A ($121) NAV $1,787 Implied P / NAV Mult. 0.28x
(2)
Hycroft Promote 4% Hycroft Current 65% Hycroft Backstop 0% Additional Shares 2% PIPE 2% Mudrick Fwd. Purch. 5% SPAC 14% SPAC Promote 8%
All figures in US$
Source: Company filings, S-4 1. Equity value assumed to be distributed pro rata amongst equity holders and equitized debt holders. 2. Shown net of SRL royalty. 3. Includes average annual G&A of $7.5 mm over the 34 year mine life discounted at 5%.
Total Promote 12% Total External Funding 21%
(3)
12
12 Components Build-Up ($ mm) Hycroft NPV $1,994 Pro Forma Debt: SRL Debt ($70) New Note ($80) Cash $65 LOM Discounted Corp. G&A ($121) NAV $1,787 Implied P / NAV Mult. 0.28x
(2)
All figures in US$
Source: Company filings, S-4 1. Equity value assumed to be distributed pro rata amongst equity holders and equitized debt holders. 2. Shown net of SRL royalty. 3. Includes average annual G&A of $7.5 mm over the 34 year mine life discounted at 5%.
Hycroft Promote 7% Hycroft Current 65% Hycroft Backstop 13% Additional Shares 1% PIPE 4% Mudrick Fwd. Purch. 5% SPAC 0% SPAC Promote 5% Total Promote 12% Total External Funding 9%
(3)
13
13
Source: Hycroft Mining Management Note: March to October 2019 production data based on actuals.
0.00% 10.00% 20.00% 30.00% 40.00% 50.00% 60.00% 70.00% 80.00% 90.00% 10 20 30 40 50 60 70
% Recovery Leach Days
Cell 1 Brimstone Recovery
Au % Recovery Ag % Recovery
Feasibility
Brimstone, Vortex, lower Camel Testing Represents:
Recoveries:
65%
Feasibility Study
increase Gold Produced:
additional operating costs
14
14
Source: Hycroft Mining Management Note: March to October 2019 production data based on actuals.
Central, Cut 5 Represents:
Recoveries:
70%
Feasibility Study
increase Gold Produced:
additional operating costs
0.00% 10.00% 20.00% 30.00% 40.00% 50.00% 60.00% 70.00% 80.00% 90.00% 100.00% 10 20 30 40 50 60 70
% Recovery Leach Days
Cell 2 Central Recovery
Au % Recovery Ag % Recovery
Feasibility
15
15
20% 10% Base 10% 20% Decrease Decrease Case Increase Increase Mining Cost $2.41B $2.24B $1.91B $1.74B Processing Cost $2.43B $2.26B $1.90B $1.71B CapEx $2.18B $2.13B $2.03B $1.98B $2.1B
Mine plan economics resilient to small changes in mining and processing costs, due to the lower operating leverage
Low sensitivity to capex, due to Hycroft’s capital light restart which leverages existing infrastructure
Au Ag $ Billions $ Billions % 1 $1,200 $16.50 $4.2 $1.7 80% 2 $1,300 $17.33 $5.1 $2.1 148% 3 $1,400 $18.67 $6.1 $2.6 304% 4 $1,500 $20.00 $7.1 $3.0 n.a. 5 $1,700 $15.50 $7.1 $3.1 n.a.
Metal Prices ($/oz.) Case NPV @ 0% NPV @ 5% After Tax IRR
Source: Hycroft Mining Management, company filings 1. August 2019 Feasibility Study (effective date of July 31, 2019), using sales prices per ounce of $1,300 Au / $17.33 Ag, see “Cautionary Note Regarding Forward-Looking Statements” section. 2. AISC includes all cash outflows other than federal income tax and initial capex during first 5 years. 3. By-product cash costs, All-in Sustaining Costs (“AISC”), and Free Cash Flow are non-GAAP financial measures, see “Cautionary Note on Non-GAAP Financial Measures” section.
Significant upside above Feasibility Study metal prices
Years 1-5 Years 1-10 LOM Production AuEq (koz) 908 2,812 12,433 By-Product Cash Costs(3) ($ / oz) $775 $626 $472 AISC(2)(3) ($ / oz) $775 $766 $548 Free Cash Flow(3) ($ mm) $123 $786 $5,062 Capital ($ mm) $225 $491 $758
16
16
Source: Note: Gold equivalent production calculated assuming $1,300/oz gold and $17.33/oz silver; August 2019 Feasibility Study (effective date of July 31, 2019) See “Cautionary Note Regarding Forward-Looking Statements.”
LIFE OF MINE — AVERAGE ANNUAL AU EQ. PRODUCTION OF ~366KOZ PER ANNUM
70 163 189 196 238 201 202 359 230 265 268 227 312 267 233 25 35 104 77 110 111 122 160 170 186 199 135 215 111 143 95 198 293 273 348 312 324 519 400 451 467 362 527 378 376 2020E 2021E 2022E 2023E 2024E 2025E 2026E 2027E 2028E 2029E 2030E 2031E 2032E 2033E 2034E - 2052E Avg.
Au Production (koz Au) Ag Production (koz Au Eq.) Average Production (koz Au Eq.)
17
17
($20) $50 $118 ($17) $86 ($12) $72 $348 $169 $240 $224 $123 $293 $157 $162 $5,071
$1,300 $1,950 $2,600 $3,250 $3,900 $4,550 $5,200 2020E 2021E 2022E 2023E 2024E 2025E 2026E 2027E 2028E 2029E 2030E 2031E 2032E 2033E 2034E - 2053E Avg. Cumulative Free Cash Flow ($ mm) Free Cash Flow ($ mm) Cumulative FCF ($ mm)
Source: August 2019 Feasibility Study (effective date of July 31, 2019) Note: Free cash flow calculated assuming $1,300/oz gold and $17.33/oz silver; See “Cautionary Note Regarding Forward-Looking Statements.” Note: Free cash flow is a Non-GAAP Financial measures; see “Cautionary Note on Non-GAAP Financial Measures.”
Continue Stockpile Mining 1st Full Year of Steady State Production Minimal upfront capital investment required for sulfide leach operations, with significant production levels and free cash flow generation
Cumulative LOM FCF of $5.1 bn
18
18
164 142 316 219 468 542 744 407 551 476 458 504 390 333 700 700 700 700 700 850 850 850 Mar-19 Apr-19 May-19 Jun-19 Jul-19 Aug-19 Sep-19 Oct-19 Nov-19 Dec-19 Jan-20 Feb-20 Mar-20 Apr-20 May-20 Jun-20 Jul-20 Aug-20 Sep-20 Oct-20 Nov-20 Dec-20 Actual Ore Placed (kt) Planned Ore Placed (kt)
Leach pads required for ore processing are constructed Crusher rebuild and commissioning completed Mobile equipment fleet restarted and operating
Source: Hycroft Mining Management
19
19
trucks, two shovels, two loaders, and support equipment
240-ton haul trucks and one loader
Source: Hycroft Mining Management
20
20
The secondary and tertiary crushers were
recommissioned and placed online in March 2019
The primary crusher was reconditioned and brought
into operation in late March 2019
Sulfide material began being fed through the crushing
system on start-up Coarse Ore Stockpile Fine Ore Stockpile Fine Ore Stockpile
Source: Hycroft Mining Management
21
21
Soda Ash added to the ore prior to the primary crusher to create an environment (pH) conducive to the oxidation of Transition and Sulfide ore Soda Ash solution added on a regular basis to Sulfide ore over the 60 to 120 day pre-oxidation period to offset evaporation and replenish carbonate consumption and maintain 8% to 10% moisture. Pads and oxidation are monitored with lysimeters which monitor oxygen, alkalinity, and other chemical levels. There are also different leach pad cells which allow the different ore domains to oxidize over different time intervals Final rinse of lime solution to remove bicarbonate from the heap and prevent cyanide loss during leaching
Source: August 2019 Feasibility Study (effective date of July 31, 2019)
2 1 3 1 2 3
22
22
Control of the oxidation process starts
at the crusher; reagent dosing of material headed into the crusher using head assay data is the most important step in the process
The monitoring system for the progress
are working as intended
Solution management to account for
inclement weather conditions has been the most challenging aspect, but has not halted progress (before and after pictured)
Data management for old pads
continues to inform the way we approach present and future challenges
For example, pH trends observed in
the first set of cells led to increased soda ash dosing at the crusher for later cells which has accelerated the
Source: Hycroft Mining Management
23
23
In occasions where solution-based monitoring of a
panel is challenging, alternative methods are available and a standard practice to ensure goals are met
Each panel has a lab column built from the same
bulk head sample run several weeks ahead of the
indicators of the pad behavior
Regular solid sampling of the pad material is
performed so that changes to the cyanide-soluble gold can be directly monitored, and the relationship between oxidation and cyanide-soluble can be documented and used for decision making
Source: Hycroft Mining Management
24
24
Test Pads 1 to 3 finalized Produced gold from pads 4 to 8; second lift of 7 and
5 to produce in 2020
Pad 9 to produce in 2020 New leach pad construction in 2020 has begun
Source: Hycroft Mining Management
25
25
($ 000's) Years 1-5 Year 1 Year 2 Year 3 Year 4 Year 5 Leach Pad & Pond Construction $50,831 $31,951 $18,425
$312
General $4,595
$400
$42,202
$9,459 $22,393 Converying & Stacking $55,596
$3,506 $36,311 Reagents $19,016
Rail Unloading & Storage $33,773
$22,981 De-watering $10,401
$376 $2,385 $3,791 Owner's Team $5,148 $4,548 $600
$2,500 $500 $500 $500 $500 $500 Total $224,774 $36,999 $23,687 $32,000 $27,097 $104,991
Source: August 2019 Feasibility Study (effective date of July 31, 2019), Street research 1. Based on August 2019 Feasibility Study (effective date of July 31, 2019) , see “Cautionary Note Regarding Forward-Looking Statements” section. 2. NPV and Capex taken from feasibility reports for the respective companies.
3% 45% 45% 64% 72% 73% 86% 87% 96% 96% 99% 117% 133% Hycroft Belo Sun Continental Orezone Corvus Victoria Sabina Liberty Lydian Osisko Mining Lundin Gold Midas Falco
$61M of initial capex during years 1-2 = 3% of project NPV
$225M of capex during years 1 to 5 to get to higher FS production levels = 11% of project NPV Initial capital costs of $61 mm
All substantial permits and rights necessary for re-start have been
received
Updated feasibility study Constructed initial leach pad Commenced ore processing First gold sold Leach Pads, 23% Crushers, 19% Conveyer / Stacker, 25% Rail System, 15% Reagents, 8% Remainder, 10%
26
26
Since 2011, more than $400 mm already spent in anticipation of mine expansion
Existing leach pads have approximately 30 mm tons of capacity
2 Merrill-Crowe plants (26,000 gpm capacity), carbon columns (6,000 gpm) and 1 refinery
Equipment for second refinery acquired and on site
Powerline and water supply in place
3-stage crushing system was installed in 2014
System re-commissioning is nearly complete
Administrative buildings, truck shop, and support facilities are built
Total Capital Spent: +$400 mm
Total Mill-Related Equipment $119
Crusher $196 Merrill-Crowe Facility $63 Truck Shop $8 Refinery and Retort $7 Mine Office, Event Drainline and Electrical Upgrade $6 Process Water Pipeline $3 3 Ball Mills $37 2 SAG Mills $32 Motors and Variable Speed Drives $31 Regrind Mill $9 Electrical Power & Distribution Equipment $6 Concentrate Thickening Equipment $4
Source: Hycroft Mining Management
27
27 The Mineral Resource and Mineral Reserve estimates contained in this presentation have been prepared in accordance with the requirements of the Modernization of Property Disclosures for Mining Registrants (the “New Mining Rules”) set forth in subpart 1300 of Regulation S-K, as promulgated by the United States Securities and Exchange Commission (“SEC”). These disclosures differ in material respects from the requirements set forth in Industry Guide 7, which remains applicable to U.S. companies subject to the reporting and disclosure requirements of the SEC that have not early adopted the New Mining Rules. These standards differ significantly from the disclosure requirements of Industry Guide 7 in that mineral resource information contained herein may not be comparable to similar information disclosed by U.S. companies that have not early adopted the New Mining Rules promulgated by the SEC. Under SEC standards, mineralization, such are mineral resources, may not be classified as a “reserve” unless the determination has been made that the mineralization could be economically and legally produce or extracted at the time of the reserve determination. The term “economically,” as used in the SEC’s Industry Guide 7 definition of reserves, means that profitable extraction or production has been established or analytically demonstrated in a feasibility study to be viable and justifiable under reasonable investment and market assumptions. The term “legally” as used in the SEC’s Industry Guide 7 definition of reserves, does not imply that all permits needed for mining and processing have been obtained or that other legal issues have been completely resolved. However, for a reserve to exist, we must have a justifiable expectation, based on applicable laws and regulations, that issuance of permits or resolution of legal issues necessary for mining and processing at a particular deposit will be accomplished in the ordinary course and in a timeframe consistent with our current mine plans. As used in this joint proxy statement/prospectus, the terms “mineral resource”, “measured mineral resource”, “indicated mineral resource” and “inferred mineral resource” are defined and used in accordance with the New Mining Rules set forth in subpart 1300 of Regulation S-K, even though such terms are not recognized under Industry Guide 7 which the New Mining Rules will replace beginning January 1, 2021 for companies that do not early adopt the New Mining Rules. You are specifically cautioned not to assume that any part or all of the mineral deposits in these categories will ever be converted into mineral reserves, as defined by the SEC. You are cautioned that, except for that portion of mineral resources classified as mineral reserves, mineral resources do not have demonstrated economic value. Inferred mineral resources have a high degree of uncertainty as to their existence as to whether they can be economically or legally
that all or any part of an inferred mineral resource will ever be upgraded to a higher category. A significant amount of exploration must be completed in order to determine whether an inferred mineral resource may be upgraded to a higher category. Therefore, you are cautioned not to assume that all or any part of an inferred mineral resource exists, that it can be economically or legally mined, or that it will ever be upgraded to a higher
reserves.
28
28
This Presentation has not been prepared in accordance with, and does not contain all of the information that is required by, the rules and regulations of the SEC. Certain financial measures, including AISC, By-Product Cash Costs and Free Cash Flow and the related pro-forma information presented in this presentation are supplemental measures of our performance, liquidity and ability to service debt are not required by, or presented in accordance with, generally accepted accounting principles in the United States (“GAAP”). Such measures are not measurements of our financial performance under GAAP and should not be considered as an alternative to net income, operating income or any other performance measures derived in accordance with GAAP or as an alternative to cash flows from operating activities as a measure of our liquidity. Non-GAAP Measure - AISC All-in Sustaining Costs (“AISC”) include total production cash costs to be incurred at Seller’s mining operation, plus sustaining capital expenditures (once the initial capital is spent) and reclamation costs, less revenue generated from silver sales. Additionally, the measure seeks to reflect the full cost of gold production from our operations, therefore initial expansionary capital is excluded. Certain other cash expenditures, including income tax payments and financing costs are also excluded. We believe that this measure represents the total costs of producing gold from current operations and provides us and other stakeholders with additional information of our operational performance and ability to generate cash flows. AISC, as a key performance measure, allows us to assess its ability to support capital expenditures and to sustain future production from the generation of operating cash flows. This information provides management with the ability to more actively manage capital programs and to make more prudent capital investment decisions. We calculate AISC on a gold ounces sold basis, where silver revenue is treated as a reduction in operating costs. This performance measure was adopted as a result of an initiative undertaken within the gold mining industry; however, this performance measure has no standardized meaning and should not be considered in isolation or as a substitute for measures of performance prepared in accordance with GAAP. Seller follows the guidance note released by the World Gold Council, which became effective January 1, 2014, in calculating AISC. The World Gold Council is a non-regulatory market development organization for the gold industry whose members comprise global senior gold mining companies. Non-GAAP Measure – By-Product Cash Costs By-Product Cash Costs incorporate our share of all production costs, including adjustments to inventory carrying values, adjusted for changes in estimates in reclamation and closure costs at the Company’s mines which are non-cash in nature, and include by-product silver credits, and treatment and refining charges included within revenue. Additionally, cash costs are adjusted for realized gains and losses arising on the Company’s commodity and foreign currency contracts which the Company may enter into to mitigate its exposure to fluctuations in by-product metal prices, heating
In addition to conventional measures, we assess this per ounce measure in a manner that isolates the impacts of gold production volumes, the by-product credits, and operating costs fluctuations such that the non-controllable and controllable variability is independently addressed. We use total cash costs: by-product per gold ounce to monitor our operating performance internally, including
sales incidental to the gold production process, thereby allowing management and other stakeholders to assess the net costs of gold production. We report by-product cash costs on a gold ounces sold basis. In the gold mining industry, this is a common performance measure but does not have any standardized meaning. We follow the recommendations of the Gold Institute Production Cost Standard. The Gold Institute, which ceased operations in 2002, was a non-regulatory body and represented a global group of producers of gold and gold products. The production cost standard developed by the Gold Institute remains the generally accepted standard of reporting cash costs of production by gold mining companies. Free Cash Flow Unlevered free cash flow is a non-GAAP financial measure that presents our ability to service debt and is determined by reducing our after-tax cash flow provided by operating activities by maintenance capital expenditures. Projections of unlevered free cash flow are not based on GAAP net income/loss or cash flow provided by operating activities, respectively, and are anticipated to be adjusted to exclude the effects of events or circumstances over the periods presented that are not representative or indicative of results of operations and that are not currently determinable. Due to the startup nature of current operations and the uncertainty of the likelihood, amount and timing of any such adjusting items, we do not have information available, without undertaking unreasonable efforts, to provide a quantitative reconciliation of any projected non-GAAP financial measures at this time. Reconciliations Our projections of AISC, By-Product Cash Costs and Free Cash Flow are not based on GAAP net income/loss or Cash flow provided by operating activities, respectively. As the Company has not reached commercial production and the uncertainty of the likelihood, we do not have information available, to provide a quantitative reconciliation of any projected non-GAAP financial measures at this time and are unable to provide such information without unreasonable effort.